Fig. 2.

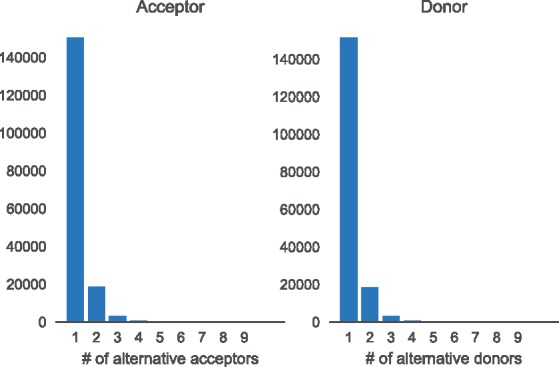
Histogram showing the complexity of annotated splicing events. For each annotated donor we count how many acceptors splice to it (left) and for each annotated acceptor we count how many donor sites are spliced to it (right)

Histogram showing the complexity of annotated splicing events. For each annotated donor we count how many acceptors splice to it (left) and for each annotated acceptor we count how many donor sites are spliced to it (right)