
Fig. 3.
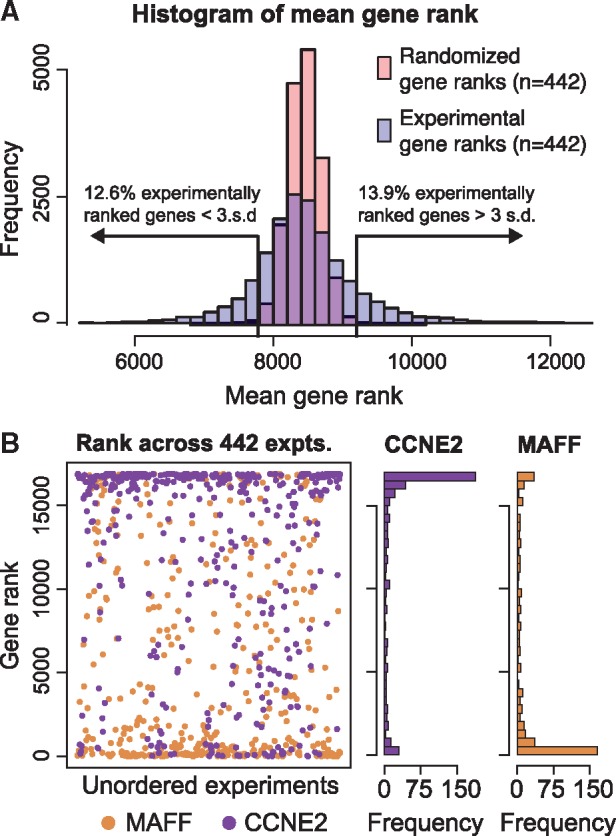
Ranking of genes across 442 small molecule gene expression profiles. (A) Distribution of the mean rank for all genes measured across 442 small molecule experiments (blue) compared to the mean rank of genes from 442 randomized gene lists (pink). Roughly 25% of genes in the experiments fall outside 3 standard deviations from the randomly ranked genes. (B) The ranks of MAFF and CCNE2 across all 442 experiments. These two genes are the highest and lowest ranked genes in (A) by mean rank across all 442 experiments