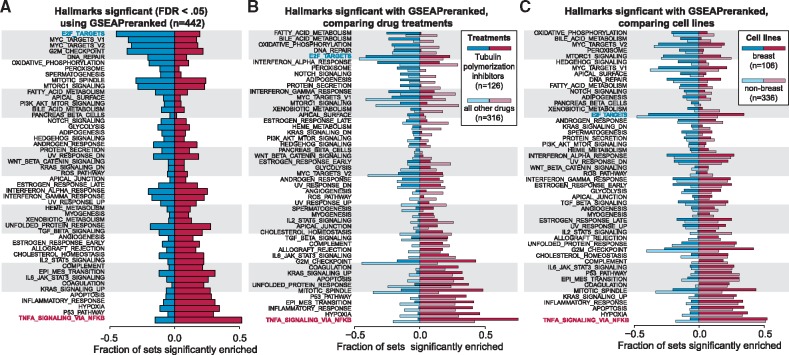
Fig. 4.
Commonly enriched gene sets across 442 small molecule gene expression experiments. (A) The gene sets in the Hallmarks collection (Liberzon et al., 2015) were tested against all 442 experiments using GSEAPreranked (competitive null hypothesis). Significant gene sets are defined as an FDR < 0.05. Gene sets are ranked by the difference in the fraction of experiments with significant positive and negative enrichment. The most frequently down-regulated pathway is E2F_TARGETS (blue text) and most commonly up-regulated pathway is TNFA_SIGNALING_VIA_NFKB (red text). (B) The fraction of positively and negatively enriched gene sets are shown for 126 experiments that tested response to eribulin or paclitaxel (dark bars), compared to 317 experiments that tested another compound (light bars). (C) The fraction of positively and negatively enriched gene sets within 107 experiments using breast cancer cell lines (dark bars), compared to 336 experiments that used non-breast cells (light bars)

