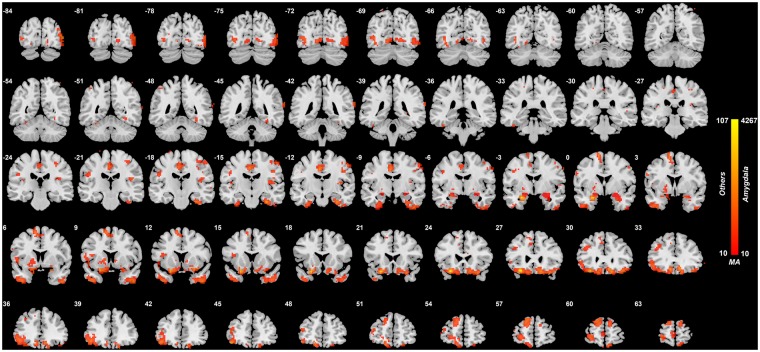
Fig. 1.
Anatomical location of consistently different FC in depression obtained from the voxel-based Association Study (vAS). Voxels showing the largest number of voxel-level FC differences with the amygdala in patients with depression. The colour bar represents the measure of association (MA) given by the number of significantly different FC links relating to each voxel. Voxels with MA larger than 10 are indicated here and elsewhere to show where the main differences are between patients with depression and controls. The right of the brain is on the right of each slice. The Y values are in MNI coordinates.

