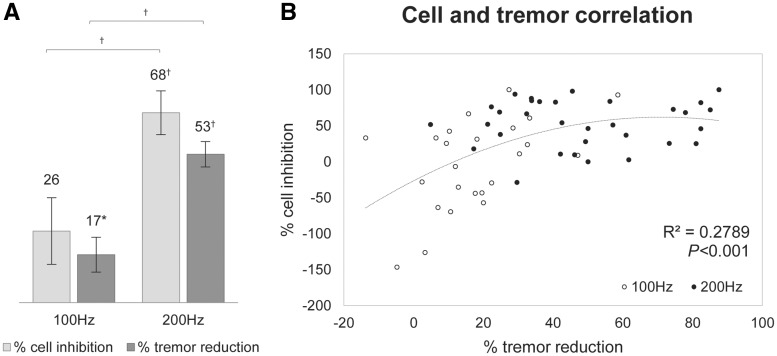
Figure 3.
Neuronal inhibition and tremor reduction. (A) The degree of cell inhibition and tremor reduction during stimulation trains at 100 Hz and 200 Hz compared to baseline for stimulations across all recording sites. At 200 Hz, there was significantly more cell inhibition and tremor reduction compared to 100 Hz. (B) The correlation between cell inhibition and tremor reduction across all recording sites, fitted with a second order polynomial. *P < 0.05, †P < 0.001.

