
Fig. 3.
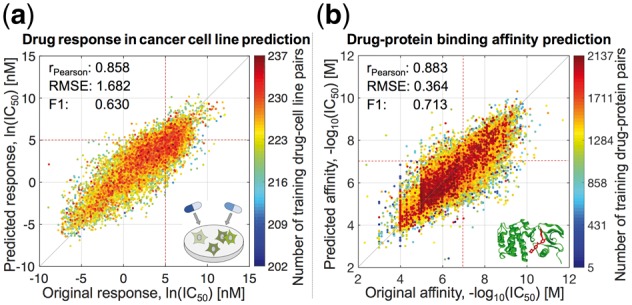
Prediction performance of pairwiseMKL in the tasks of (a) drug response in cancer cell line prediction and (b) drug–protein binding affinity prediction. Scatter plots between original and predicted bioactivity values across (a) 15 376 drug–cell line pairs and (b) 167 995 drug–protein pairs. Performance measures were averaged over 10 outer CV folds. F1 score was calculated using the threshold of (a) ln(IC50) = 5 nM, (b) −log10(IC50) = 7 M, both corresponding to low drug concentration of roughly 100 nM, i.e. relatively stringent potency threshold (red dotted lines). Color coding indicates the number of training data points, i.e. drug–cell line (respectively drug–protein) pairs including the same drug or cell line (drug or protein) as the test data point.