Figure 4.
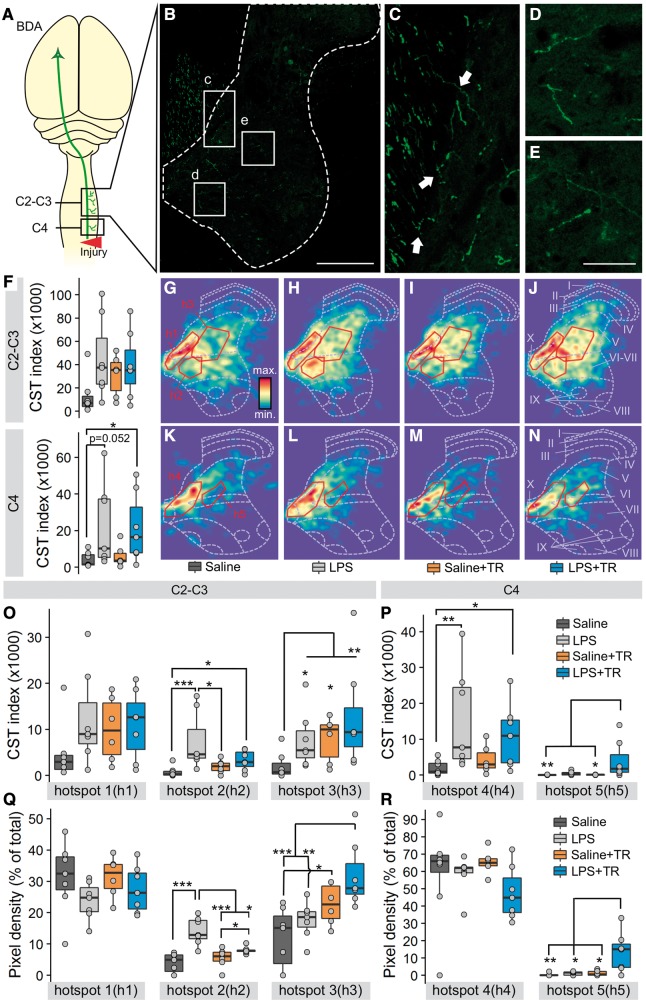
High intensity training, systemic LPS injections or the combination of both induce differential changes in the corticospinal tract projections above the injury site. At the end of the training period BDA was injected in the M1 forelimb cortical area. Two weeks later BDA-traced axons were counted in cross sections of the spinal cord in two blocks, C2–C3 and C4 (A). A representative image of the BDA+ staining for the C2–C3 region (B) shows the descending BDA-traced corticospinal axons in the dorsal column and their projection into the grey matter (white dotted line). Traced axons entering from the dorsal column to the grey matter (C, arrows) and reaching farther distances (E and D) can be appreciated. Insets c–e are expanded in C–E. The corticospinal tract index of the whole grey matter (F, BDA+ pixels/number of corticospinal traced axons) was higher in LPS, Saline+TR and LPS+TR groups for C2-C3 (F, top) than Saline group without reaching statistical significance between groups [KWch(3) = 6.47, P = 0.09]. For the C4 region (F, bottom) the CST index was significantly different between groups [KWch(3) = 8.09, P = 0.044], being higher comparing the LPS+TR group with the Saline group (P = 0.042). The differences between LPS and Saline groups were close to being significant (P = 0.052). Heat maps of the BDA+ pixels in the grey matter for each group and for each analysed region were generated (G–N). A density-based spatial clustering (DBSCAN) method was used to identify highly dense regions (hotspots) in the heat maps. Five hotspots were defined (solid line insets in G–N), three in the C–C3 region (h1, h2 and h3) and two in the C4 region (h4 and h5). The CST index (O and P) represents the total amount of BDA+ pixels per traced axon for each hotspot. The pixel density (Q and R) represents the percentage of BDA+ pixels in each hotspot in respect to the total BDA+ pixels, a measure of the BDA staining distribution. In the CST index, differences between groups were found at h2 [KWch(3) = 12.78, P = 0.005], h3 [KWch(3) = 9.6, P = 0.022], h4 [KWch(3) = 10.44, P = 0.02] and h5 [KWch(3) = 10.99, P = 0.01], but not at h1 [KWch(3) = 4.12, P = 0.24]. The comparison between groups in pixel density revealed statistical differences at h2 [KWch(3) = 13.87, P < 0.0001], h3 [KWch(3) = 7.19, P = 0.001] and h5 [KWch(3) = 11.04, P = 0.011], but not at h1 [KWch(3) = 1.31, P = 0.29] nor h4 [KWch(3) = 6.04, P = 0.11]. ***P < 0.001, **P < 0.01, *P < 0.05. In box-plots median (middle line), first and third quartile range (box) and IQR of 1.5 (whiskers) are represented.

