Fig. 3.

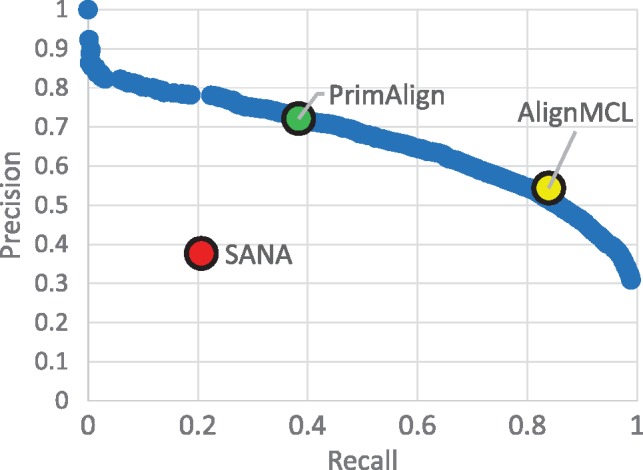
Example of P-R curve. P-R curve of PrimAlign for the 1st synthetic network compared with SANA and AlignMCL. The result of PrimAlign for the default threshold is highlighted.

Example of P-R curve. P-R curve of PrimAlign for the 1st synthetic network compared with SANA and AlignMCL. The result of PrimAlign for the default threshold is highlighted.