
Fig. 1.
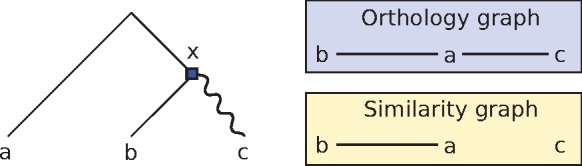
An example of gene tree for the gene family {a, b, c}, along with the underlying orthology and similarity graphs. The root of the tree is a speciation, the square is a duplication, and the wiggly edge represents an event of divergence after duplication. The gene pairs ab and ac are orthologs. However, a and c will not appear as ‘similar’, as there was a significant divergence event on their evolutionary path