
Fig. 2.
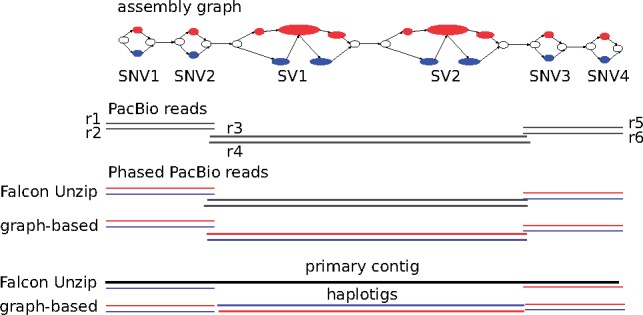
Input: an assembly graph (top) (consisting of four SNVs and two SVs) and the PacBio reads (gray). Output: the phased reads (colored in blue and red) and haplotigs (bottom) using Falcon Unzip and our approach. Our graph-based approach also phases the central region. Contrarily, Falcon Unzip does not phase it, and so the region does not contribute to the total haplotig size