
Fig. 4.
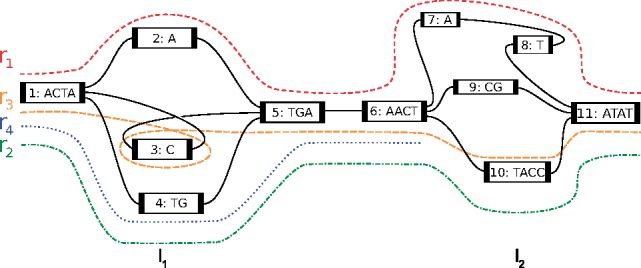
For a subgraph of Gs, the example shows two bubbles l1 and l2, and their corresponding alleles. Reads traverse these bubbles
Official websites use .gov
A
.gov website belongs to an official
government organization in the United States.
Secure .gov websites use HTTPS
A lock (
) or https:// means you've safely
connected to the .gov website. Share sensitive
information only on official, secure websites.
For a subgraph of Gs, the example shows two bubbles l1 and l2, and their corresponding alleles. Reads traverse these bubbles