The combined use of EPR spectroscopy and the specific fluorescent dye 4,5-diaminofluorescein diacetate uncovers sites of nitric oxide production in legume nodules and warns of potential artifacts.
Keywords: Denitrification, electron paramagnetic resonance, leghemoglobin, nitric oxide, nitrogen fixation, symbiosis
Abstract
Nitric oxide (NO) is a signaling molecule with multiple functions in plants. Given its critical importance and reactivity as a gaseous free radical, we have examined NO production in legume nodules using electron paramagnetic resonance (EPR) spectroscopy and the specific fluorescent dye 4,5-diaminofluorescein diacetate. Also, in this context, we critically assess previous and current views of NO production and detection in nodules. EPR of intact nodules revealed that nitrosyl-leghemoglobin (Lb2+NO) was absent from bean or soybean nodules regardless of nitrate supply, but accumulated in soybean nodules treated with nitrate that were defective in nitrite or nitric oxide reductases or that were exposed to ambient temperature. Consequently, bacteroids are a major source of NO, denitrification enzymes are required for NO homeostasis, and Lb2+NO is not responsible for the inhibition of nitrogen fixation by nitrate. Further, we noted that Lb2+NO is artifactually generated in nodule extracts or in intact nodules not analyzed immediately after detachment. The fluorescent probe detected NO formation in bean and soybean nodule infected cells and in soybean nodule parenchyma. The NO signal was slightly decreased by inhibitors of nitrate reductase but not by those of nitric oxide synthase, which could indicate a minor contribution of plant nitrate reductase and supports the existence of nitrate- and arginine-independent pathways for NO production. Together, our data indicate that EPR and fluorometric methods are complementary to draw reliable conclusions about NO production in plants.
Introduction
Nitric oxide (NO) is a gaseous free radical and signal molecule involved in a vast array of physiological processes of plants, including legume nodule formation and development (Hichri et al., 2016). Thus, NO was detected after infection of roots by rhizobia in the model legumes Lotus japonicus (Nagata et al., 2008) and Medicago truncatula (del Giudice et al., 2011). In L. japonicus roots inoculated with Mesorhizobium loti, the NO concentration increases after ~4 h and then decreases due to the induction of a non-symbiotic hemoglobin (LjGlb1-1) which scavenges NO and thus avoids triggering the defense response of the plant (Nagata et al., 2008; Fukudome et al., 2016). Mutant plants of L. japonicus defective in LjGlb1-1 have lower infection rates, fewer nodules, and a higher NO level in roots than the wild-type (WT) plants, indicating that this hemoglobin is required for M. loti infection, probably by regulating the NO level in the roots (Fukudome et al., 2016). Likewise, several studies with NO scavengers and NO biosensor bacterial strains have shown that NO production is critical at the early stages of the M. truncatula–Sinorhizobium meliloti interaction (del Giudice et al., 2011).
The homeostasis of NO is also important in mature and senescent nodules because of the dual effects of NO. On the one hand, NO inhibits nitrogenase activity (Trinchant and Rigaud, 1982; Sasakura et al., 2006; Kato et al., 2010) and is the precursor of nitrating molecules that can alter the activity of key nodule proteins such as glutamine synthetase and leghemoglobin (Lb) through tyrosine nitration (Melo et al., 2011; Sainz et al., 2015) or heme nitration (Navascués et al., 2012). On the other hand, low and steady NO concentrations are needed to maintain nodule functioning (Shimoda et al., 2005; Cam et al., 2012). The major sources of NO in nodules are the cytosolic nitrate reductase (NR) and the mitochondrial electron transport chain in the host cells, and the periplasmic nitrate reductase (Nap) and the respiratory nitrite reductase (NirK) in the bacteroids (Meakin et al., 2007; Sánchez et al., 2010; Horchani et al., 2011). Additional possible sources of NO, such as a putative NO synthase (NOS) activity initially reported in lupine nodules (Cueto et al., 1996), remain to be identified.
Several studies have examined NO production in nodules. EPR and Soret–visible spectroscopies were used to detect the highly stable nitrosyl-leghemoglobin (Lb2+NO) complex in crude Lb preparations, nodule extracts, or intact nodules (Maskall et al., 1977; Kanayama et al., 1990; Mathieu et al., 1998; Meakin et al., 2007; Sánchez et al., 2010). On the other hand, using a specific dye, NO was found in nodules of M. truncatula and alfalfa but not in those of peanut (Baudouin et al., 2006; Maiti et al., 2012; Meilhoc et al., 2013). Because of the equivocal nature of these results, we have undertaken a detailed study to detect, localize, and compare NO production by using EPR in intact nodules and a fluorescent dye in nodule sections. To this end, we chose soybean and bean for two reasons: (i) these legumes produce nodules with a well-defined determinate growth pattern (Minchin et al., 2008) in which NO has not been localized to date; and (ii) a comparison of NO production in bean and soybean nodules is useful to gain insight into the contribution of NO3− as an NO precursor because soybean nodule bacteroids express Nap and other enzymes of the denitrification pathway (Sánchez et al., 2010), whereas bean nodule bacteroids are devoid of respiratory nitrate and nitrite reductases (Becana et al., 1989). Here, we used both legumes, along with bradyrhizobial mutants defective in denitrification enzymes, to examine NO production in the absence and presence of NO3−. Based on our findings, we suggest that only EPR of intact nodules that have been flash-frozen and analyzed immediately after their detachment provides genuine measurements of NO production in vivo, albeit the method is limited to NO generated in the infected zone. Notably, NO was undetectable by EPR in bean or soybean nodules regardless of NO3− supply, but it was observed in soybean nodules treated with NO3− that lack bacteroid NirK or nitric oxide reductase (Nor), or that were left at 23 °C for 1 h. Our results also indicate that fluorescent dyes cannot be used to quantify NO production but only to assess the potential of nodule cells to generate NO. This technique allowed us to localize NO in the infected cells of the central zone, but also in the mid/inner cortex (nodule parenchyma), where the O2 diffusion barrier (ODB) is located. In the light of these and other data described in detail here, we critically discuss previous and current views of NO production and detection in legume nodules.
Materials and methods
Biological material and plant growth
Common bean (Phaseolus vulgaris L. cv. Contender) seedlings were inoculated with Rhizobium leguminosarum bv. phaseoli strain 3622. Soybean (Glycine max Merr. cv. Williams) seedlings were inoculated with Bradyrhizobium diazoefficiens strain USDA110 or the mutant derivatives GRPA1 (napA), GRK308 (nirK), and GRC131 (norC), which are defective, respectively, in the enzymes Nap, NirK, and Nor of the denitrification pathway (Sánchez et al., 2010). Both legumes were inoculated 7 d after germination and were grown in pots containing a perlite:vermiculite (1:1, v/v) mixture in a controlled-environment chamber, with a 24 °C/21 °C day/night regime, 16 h photoperiod, and 350 μmol m−2 s−1 light intensity. Plants were grown for ~30 d (bean) and ~35 d (soybean) in a nutrient solution omitting NO3− (Matamoros et al., 2006). For studies of NO3−-induced nodule senescence, plants were treated with 10 mM KNO3 in the nutrient solution for 4 d for bean and 3 d or 6 d for soybean. These plants were harvested at the same age as those not receiving KNO3.
Leghemoglobin derivatives
Soybean Lba and bean Lba were purified in the ferric state (Lb3+) according to published protocols (Becana and Klucas, 1990). The ferrous form (Lb2+) was obtained by adding a trace of sodium dithionite and the oxyferrous form (Lb2+O2) by passing Lb2+ through a Sephadex G-25 mini-column (NAP-5; GE Healthcare). Lb2+NO was produced by incubating Lb2+ with the NO donor diethylamine NONOate (DEA; Sigma-Aldrich) as follows. To an Eppendorf tube containing 10 μl of 1.5 mM Lb3+ and 220 μl of 50 mM potassium phosphate buffer (pH 7.0), a trace of dithionite was added and gently dissolved by inversion to generate Lb2+. This solution was immediately mixed with 10 μl of 6 mM DEA and incubated at 23 °C for 5 min. Alternatively, Lb2+NO was generated by adding a trace of NO2− to the Lb2+ solution.
For EPR measurements, the Lb3+, Lb2+, Lb2+O2, and Lb2+NO solutions were made up to 20% of glycerol inmediately after preparation. Glycerol avoids formation of microcrystalline ice that causes broadening and deformation of the EPR signal and can even break the EPR sample tubes. About 150 μl was loaded in the EPR tube. Samples were frozen by introducing the tube into the EPR cryostat and analyzed using conditions described below for bean and soybean nodules. All Lb forms were analyzed at a final concentration of 50 μM and their identities were confirmed by the Soret–visible spectra. All measurements were performed in two independent Lb preparations with identical results.
NO detection with EPR
Nodules of similar size were harvested from plants and immediately introduced into cylindrical EPR tubes (3 mm internal diameter) under liquid nitrogen. The tubes were filled with nodules of a similar size (<20% variability), closely packed to a depth of ~3 cm, and were placed into an Oxford CF900 cryostat (Oxford Instruments, Eynsham, UK), and refrigerated by a continuous flow of liquid He, in the interior of the EPR cavity. The EPR spectrometer was a Bruker ELEXYS E580 (Bruker; Karlsruhe, Germany) operating at the X band (microwave frequency ~9.5 GHz). Typical measurement conditions were: temperature, 80 K; microwave power, 2 mW; modulation amplitude, 0.2 mT. The microwave power and modulation amplitude were chosen so that there was no signal saturation or distortion. The measured spectra were numerically smoothed by using an ‘adjacent-averaging’ filter in order to reduce noise without loss of signal. All EPR measurements were made in nodules from two series of bean and soybean plants grown independently with similar results. For EPR measurements of nodule extracts, 100 mg of bean and soybean nodules treated with NO3− were homogeneized with 500 μl of 50 mM potassium phosphate buffer (pH 7.0) at 0 °C. The extracts were cleared by centrifugation (15000 g, 4 °C) and the soluble fraction was made to 20% with glycerol, frozen, and immediately analyzed.
NO detection with a fluorescent probe
Fresh nodules were cut into 90 μm sections in 10 mM Tris–HCl (pH 7.4) and 10 mM KCl using a VT1000S vibratome (Leica; Wetzler, Germany). Sections were incubated for 30 min at 23 °C with 10 μM 4,5-diaminofluorescein diacetate (DAF-2 DA; Sigma-Aldrich), washed three times for 5 min with the same buffer, mounted on a slide with buffer:glycerol (1:1), and observed using a Leica SP2 confocal microscope with excitation at 488 nm and emission at 498–549 nm. To ascertain that NO was the reactive nitrogen species being produced, nodule sections were incubated with the NO scavenger 2-(4-carboxyphenyl)-4,4,5,5-tetramethylimidazoline-1-oxyl-3-oxide (cPTIO; Calbiochem). This compound was used at a concentration of 1 mM for 1 h in the dark and was also added to the incubation medium with DAF-2 DA.
For studies with enzyme inhibitors, nodule sections were incubated in the dark with 1 mM or 5 mM NG-monomethyl-l-arginine (l-NMMA), NG-nitro-l-arginine (l-NNA), or sodium tungstate (Na2WO4) for 1–2 h at 23 °C. Arginine analogs were purchased from Calbiochem (La Jolla, CA, USA) and Na2WO4 from Sigma-Aldrich. After removing the solution, the nodule sections were incubated for 30 min with 10 μM DAF-2 DA along with the corresponding freshly prepared inhibitors. The sections were then washed twice, mounted on slides, and visualized by confocal laser scanning microscopy (CLSM) as indicated above.
For studies of co-localization of NO production and bacteroids, nodule sections were incubated with 10 μM DAF-2 DA and 1 μM SYTO 83 (Life Technologies, USA) for 30 min in the dark. The sections were then washed twice, mounted, and observed by CLSM with the same settings as above for DAF-2 DA and with excitation at 543 nm and emission at 560–615 nm for SYTO 83.
All CLSM studies were performed using nodules from at least two series of bean and soybean plants grown independently with similar results, and representative images are shown in all the figures.
Results and Discussion
Identification of EPR signals of leghemoglobins in vitro and in vivo
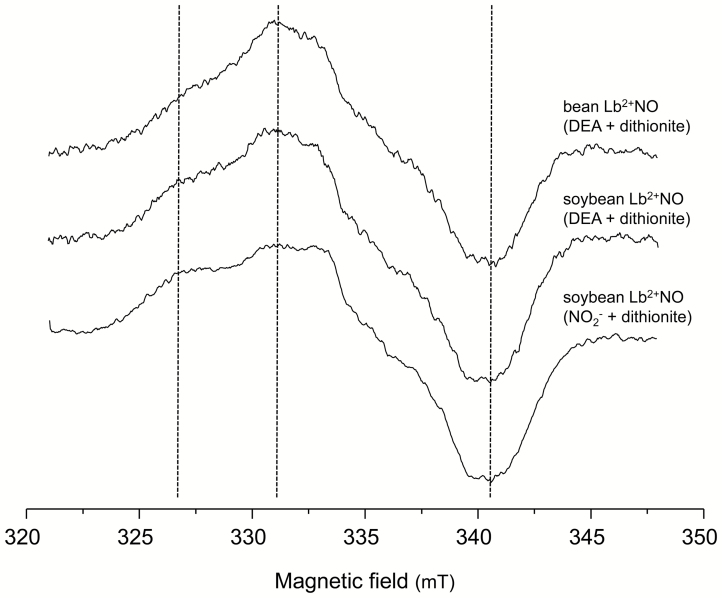
Under physiological conditions, soybean nodules contain ~80% Lb2+, ~20% Lb2+O2, and, if any, negligible amounts of Lb3+ (Appleby, 1984; Lee et al., 1995). Consequently, a prerequisite to attempt to detect Lb2+NO in nodules was to characterize the EPR spectra of all those Lb species using purified proteins. Supplementary Fig. S1 at JXB online shows that, under our measurement conditions, Lb2+ and Lb2+O2 were EPR silent, whereas Lb2+NO displayed a signal in the 320–350 mT (g ~2.0) region. More specifically, Fig. 1 shows that the Lb2+NO signal has a characteristic shape with an increasing shoulder at 326 mT, a maximum at 331 mT, and a sharp minimum at 341 mT. In this figure it can also be observed that identical spectra were obtained when Lb2+NO was produced from Lb3+ with an NO donor (DEA) plus dithionite or with NO2− plus dithionite. We associated this signal with an electronic spin S=1/2 with principal values of the g tensor gx ~2.07, gy ~2.00, and gz ~1.97, and a partially unresolved hyperfine interaction with one 14N nucleus; the signal is typical of the heme2+-NO species as previously reported for hemoglobin (Doetschman and Utterback, 1981) and cytochrome P-450 (Tsubaki et al., 1987). Moreover, Lb3+ typically displayed a signal in the 100 mT (g ~6.0) region, but this signal was noticeable only at low temperatures (<25 K) and could not be detected at 80 K (Supplementary Fig. S2).
Fig. 1.
EPR spectra of the Lb2+NO complex obtained by two methods. Vertical dotted lines indicate the main features of the Lb2+NO signal, with a shoulder at 326 mT, a maximum at 331 mT, and a minimum at 341 mT.
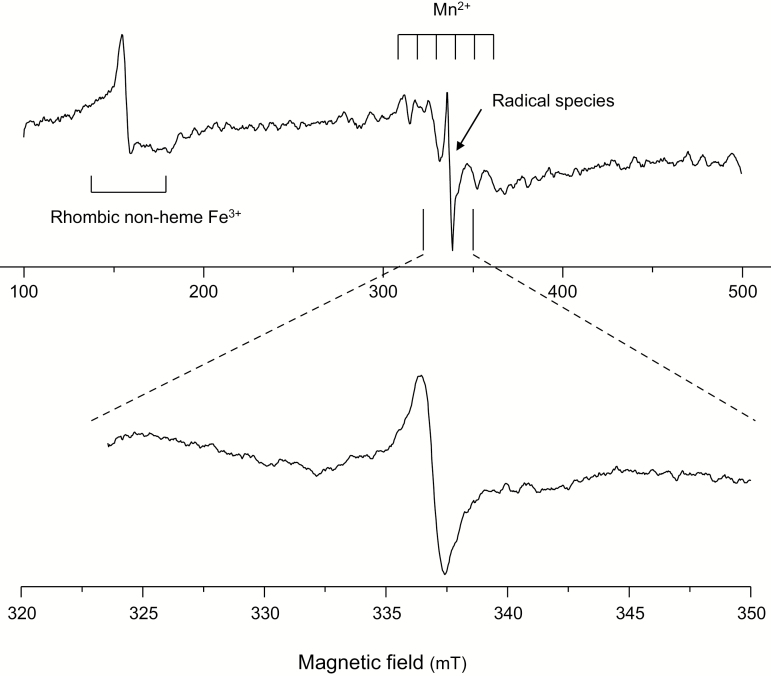
The next necessary step of our study was to characterize the EPR signals of intact nodules. Figure 2 shows a typical EPR spectrum of intact soybean nodules, in which three main features can be distinguished: (i) a single, non-symmetric signal in the 150 mT region (g ~4.3) which is due to one or several non-heme Fe3+ species in a rhombic or low symmetry environment; (ii) a feature spreading out in the range of 300–360 mT which is characterized by six equally spaced signals and corresponds to one or several Mn2+ species; and (iii) a rather narrow, intense signal at 337 mT (g ~2.0) which can be ascribed to one or several organic radical species. Intact bean nodules showed similar spectral features (rhombic non-heme Fe3+, Mn2+, and radical species), albeit the pattern associated with Mn2+ was relatively more intense and the six-line pattern signal was more defined (Supplementary Fig. S3).
Fig. 2.
EPR spectrum of intact soybean nodules showing three types of features. These correspond to the signals of rhombic non-heme Fe3+ (g=4.3), Mn2+ (six equally spaced lines centered at g=2.0), and organic free radicals (intense narrow signal at g=2.0). The Lb2+NO signal, if present, appears superimposed on these features (see text for details).
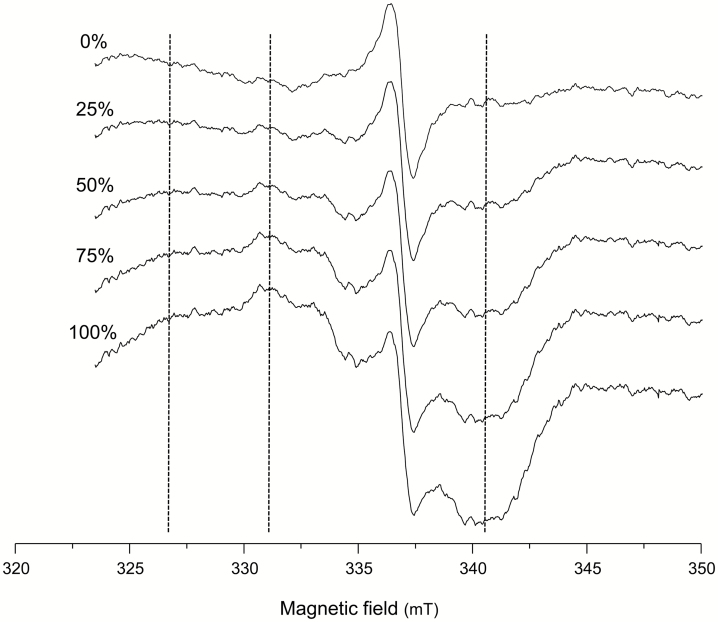
These three distinctive signals were found in all soybean and bean nodule samples examined in our study. The EPR signal of Lb2+NO, if present in nodules, would overlap with signals (ii) and (iii), as may be inferred from the spectral characteristics of purified Lb2+NO (compare the range of 320–350 mT in Figs 1 and 2). In this field range, the Mn2+ species displays a positive shoulder at 324 mT and a negative shoulder at 342 mT, whereas the signal of Lb2+NO is narrower than all the other features and is readily distinguished. To visualize this, we performed a numerical addition of the spectra of intact soybean nodules and the spectra of authentic Lb2+NO at variable proportions (Fig. 3). This figure predicts that nodules containing Lb2+NO will show spectra with a clear diagnostic signal in the range of 320–345 mT.
Fig. 3.
EPR spectra obtained by numerical addition of the signals of intact soybean nodules and different percentages of authentic Lb2+NO. Direct comparison of the experimental data with these spectra allows the demonstration of the presence of Lb2+NO. Vertical dotted lines indicate the main features of the Lb2+NO signal, with a shoulder at 326 mT, a maximum at 331 mT, and a minimum at 341 mT.
Nitrosyl-leghemoglobin only occurs at significant concentrations in soybean nodules defective in bacteroid nitrite or nitric oxide reductases
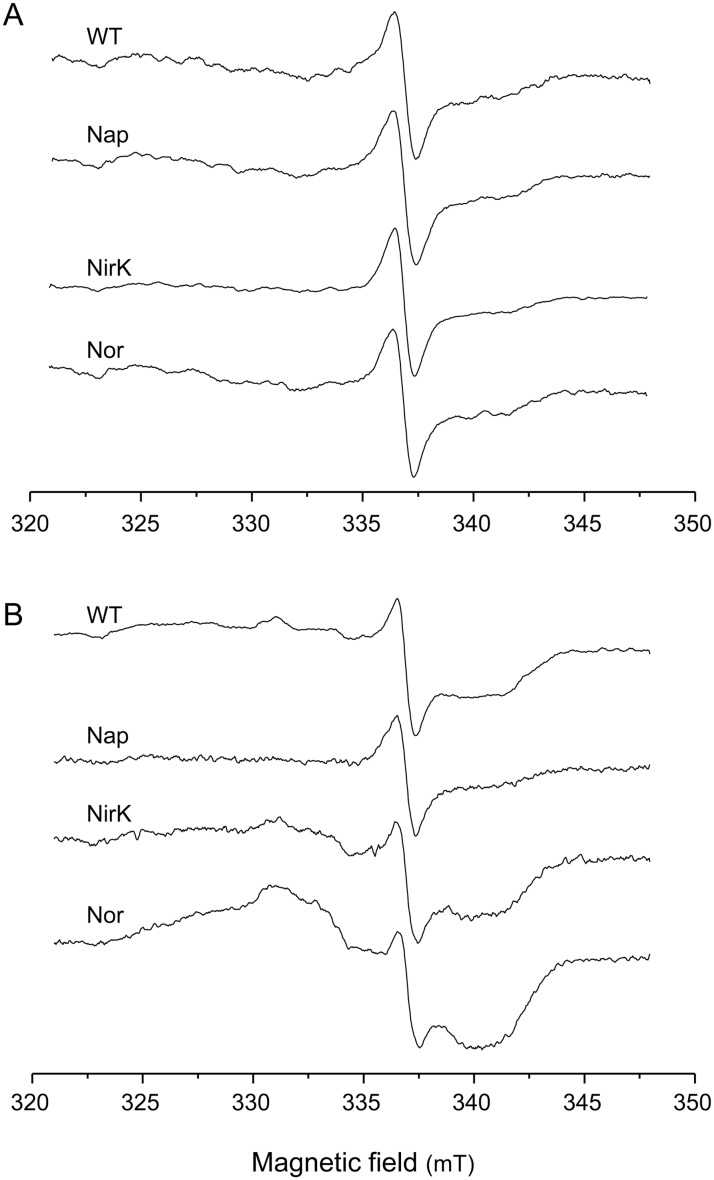
The observations described so far indicate that EPR is an excellent method to identify Lb2+NO in nodules for two reasons: (i) the nitrosyl complex has diagnostic spectral features compared with other Lb forms; and (ii) EPR can be used with intact nodules, precluding possible artifacts that may arise during nodule sectioning or extraction. In this study, we performed experiments to detect Lb2+NO by EPR in bean and soybean nodules treated or not with NO3−. Soybean nodules were produced with the WT strain as well as with the bradyrhizobial mutants napA, nirK, and norC. To avoid artifacts, it was critical to collect intact nodules directly from the plants into the EPR tubes, while immersed in liquid nitrogen. Following this procedure, we were unable to detect Lb2+NO in bean nodules with or without NO3− (Supplementary Fig. S4) or in soybean nodules formed by any of the strains after 3 d with NO3− (Fig. 4A). In contrast, Lb2+NO was clearly observed in soybean nodules formed by the nirK or norC mutants after 6 d with NO3− (Fig. 4B). The diagnostic signal of Lb2+NO appears to overlap with those of organic radicals, between 323 mT and 345 mT, exactly as in the predicted spectra of Fig. 3. Indeed, the comparison of spectra in Figs 3 and 4 enabled us to identify Lb2+NO in nodules. The spectra of the WT, NirK, and Nor nodules in Fig. 4B are similar, respectively, to the spectra containing 25, 50, and 75% Lb2+NO shown in Fig. 3. In contrast, the spectra of Fig. 4A, as well as the spectrum of Nap-deficient nodules of Fig. 4B, lack the Lb2+NO signal. Therefore, the Nap enzyme contributes to Lb2+NO production in nodules after 6 d with NO3−.
Fig. 4.
EPR spectra of intact soybean nodules. Plants nodulated with B. diazoefficiens strain USDA110 (WT) and the mutant derivatives napA, nirK, or norC were treated with 10 mM KNO3 for (A) 3 d or (B) 6 d.
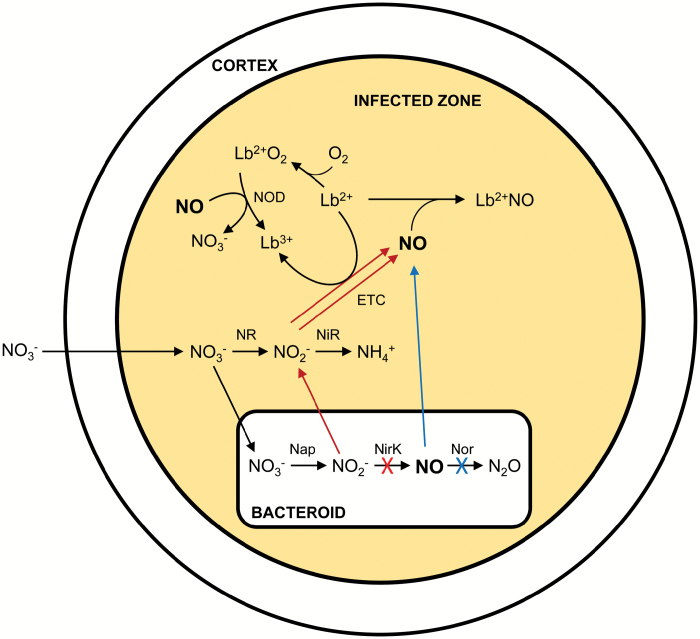
The simpler explanation for our observations of Lb2+NO in vivo is that NO3− has restricted access to the bacteroids after 3 d (Sprent et al., 1987; Becana et al., 1989) because otherwise nodules lacking NirK or Nor would contain Lb2+NO at this stage. An alternative explanation, however, is that NO3− is present in the bacteroids after 3 d (Arrese-Igor et al., 1998), but the generated NO is scavenged by metabolic reactions. Such scavenging may occur by nitrosylation of protein cysteine residues or, most probably, by the NO dioxygenase (NOD) activity of Lb2+O2 that converts NO into NO3− in the cytosol of infected cells (Calvo-Begueria et al., 2017). In this scenario, Lb2+NO would be detectable in nodules only when at least two mechanisms controlling NO concentration, NOD activity in the cytosol and NirK or Nor activities in the bacteroids, were overwhelmed (Fig. 5). Thus, after 6 d with NO3−, the nirK nodules accumulate NO2−, which diffuses out of the bacteroids and is reduced to NO by Lb2+. This Lb form is found at concentrations of 1–2 mM in nodules and may act as a dissimilatory nitrite reductase generating NO. This is shown in vitro by reducing soybean Lb3+ to Lb2+ with a trace of dithionite and then adding NO2− (Fig. 1), and has been reported for other ferrous hemoglobins of plants and cyanobacteria (Sturms et al., 2011). It cannot be entirely ruled out, however, that NO2− is also reduced by the mitochondrial electron transport chain (Horchani et al., 2011). In the norC nodules, NO accumulates, diffuses out of the bacteroids, and binds to cytosolic Lb2+. It is thus evident from our results that bacteroid NirK and Nor act sequentially to keep NO under control. This would prevent the accumulation of functionally inactive Lb2+NO, thereby protecting N2 fixation.
Fig. 5.
Scheme showing NO production in soybean nodules. The pathways for NO production in nodules formed by the nirK and norC mutants are marked in red and blue, respectively. Common reactions are in black. For simplicity, the last denitrification step (reduction of N2O to N2 by nitrous oxide reductase) of bacteroids is omitted. ETC, electron transport chain; NR, cytosolic nitrate reductase; NiR, plastidic nitrite reductase; NOD, NO dioxygenase.
Nitrosyl-leghemoglobin is artifactually generated in nodule extracts or in intact nodules soon after detachment
Our results showing that Lb2+NO is absent from WT nodules exposed to NO3− for up to 6 d refute the proposal that Lb2+NO is responsible for the inhibition of N2 fixation by NO3− and is also in sharp contrast to the detection of Lb2+NO by Soret–visible spectroscopy in extracts from soybean and cowpea nodules (Maskall et al., 1977; Kanayama et al., 1990; Kanayama and Yamamoto, 1991; Meakin et al., 2007; Sánchez et al., 2010). These contradictory results led us to investigate whether Lb2+NO was formed artifactually during extraction of nodule Lb. Supplementary Fig. S5 shows EPR spectra of soluble extracts from bean nodules treated with 10 mM KNO3 for 4 d and from soybean nodules treated similarly for 3 d or 6 d. The extracts were prepared at 0 °C, cleared by centrifugation, and frozen in liquid nitrogen. We could not detect Lb2+NO in bean nodule extracts, as occurred for the corresponding intact nodules (Supplementary Fig. S4), which may be explained by the absence of denitrifying enzymes in bean nodule bacteroids. However, Lb2+NO was found in both soybean nodule extracts at similarly high levels (Supplementary Fig. S5), which disagrees with the observations on the respective intact nodules (spectra of WT nodules in Fig. 4A and B) and unveils the artifactual origin of Lb2+NO. This artifact may occur when NO3− in the cortex of soybean nodules, which may be at a relatively high concentration (Becana et al., 1989; Arrese-Igor et al., 1998), is brought into contact with the bacteroids during nodule extraction.
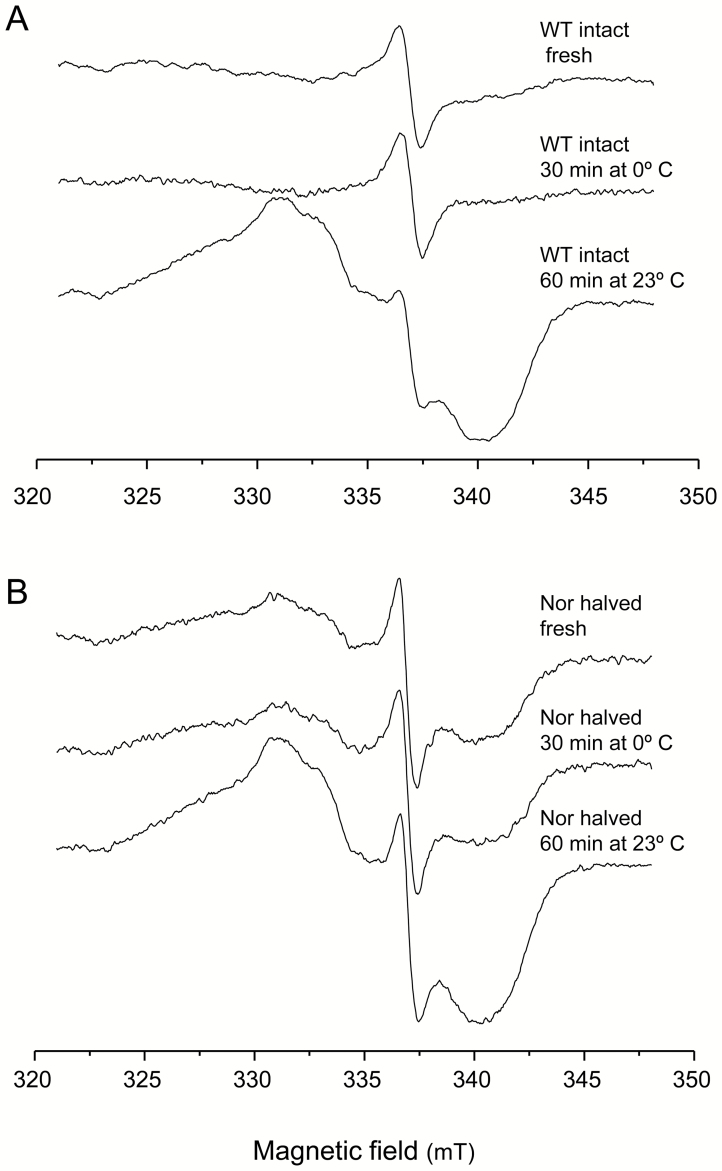
To verify the spurious production of Lb2+NO, we examined intact WT nodules that had been treated with NO3− for 3 d. These nodules, when immediately analyzed or kept at 0 °C for 30 min, did not contain Lb2+NO, but this was produced if nodules were left at 23 °C for 60 min (Fig. 6A). In a parallel experiment, norC nodules that had been exposed to NO3− for 6 d were cut in half. The nodules were then either immediately analyzed or left to stand at 0 °C for 30 min or at 23 °C for 60 min. The Lb2+NO content was similar in halved nodules immediately frozen in liquid nitrogen and in those kept on ice, but it increased after incubation at 23 °C (Fig. 6B). The temperature-sensitive production of NO in the infected zone is attributable to the denitrification enzymes, whose activities are induced by the decrease in O2 concentration after detaching the nodules (Arrese-Igor et al., 1998; Bueno et al., 2012).
Fig. 6.
EPR spectra of soybean nodules showing artifactual production of Lb2+NO. Plants nodulated with the (A) WT and (B) norC strains were treated with 10 mM KNO3 for 3 d or 6 d, repectively. For (A), nodules were flash-frozen in liquid nitrogen immediately after detachment (fresh) or left to stand at 0 °C for 30 min or at 23 °C for 60 min. For (B), nodules were halved and immediately frozen in liquid nitrogen or left to stand at 0 °C for 30 min or at 23 °C for 60 min.
Notably, our results are at odds with a previous EPR analysis of intact soybean nodules (Mathieu et al., 1998). A detailed comparison of the spectra presented in the two studies points out some differences: (i) these authors assigned a magnetic field signal at g=3.3 to metal ions, mainly Fe3+ species, but we identified the signal of non-heme Fe3+ at g=4.3; (ii) they did not find any Mn2+ signal; and (iii) the spectrum of their preparation of Lb2+NO is not identical to our spectra of soybean or bean Lb2+NO. We obtained identical EPR spectra for Lb2+NO synthesized by two methods (Fig. 1), and the EPR signals of Lb2+NO combined numerically with the signals of intact nodules yielded the spectra that would be expected for nodules containing even small amounts of Lb2+NO (Fig. 3). We found exactly those spectra in soybean nodules deficient in NirK or Nor, indicating that, in our hands, EPR was a sensitive and specific method for Lb2+NO detection. However, we did not detect Lb2+NO in WT nodules with or without NO3−, in contrast to Mathieu et al. (1998). We cannot offer a conclusive explanation for all these discrepancies in the spectra and results, but they could be attributed to variations in measurement conditions, sample processing, the physiological state of nodules, or a combination of those factors.
NO is detected with a fluorescent dye in the infected zone of nodules not treated with nitrate and in the parenchyma of soybean nodules
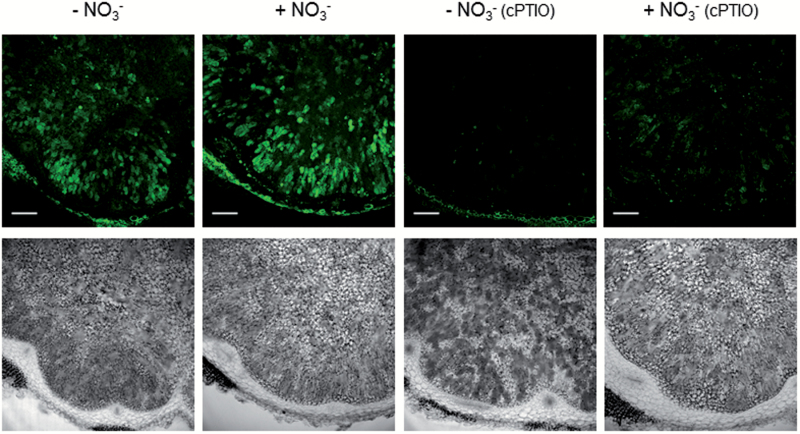
The results of EPR spectroscopy were tested using DAF-2 DA. This dye is deacetylated by intracellular esterases to DAF-2, which then reacts with NO under aerobic conditions to yield triazolofluorescein, a derivative that emits an intense green fluorescence. This method requires the use of strict controls to prove the absence of endogenous fluorescence in the plant tissue and the inhibition of the signal by the NO scavenger cPTIO (Mur et al., 2011). We sectioned fresh bean and soybean nodules and immediately incubated the sections with the dye to allow its reaction with NO. For both types of nodules we ran parallel controls omitting the dye, which showed no background fluorescence. In bean nodules, the green fluorescence was localized in the infected zone of nodules not given NO3− and was slightly enhanced in nodules treated with NO3− (Fig. 7). The fluorescence signal was abolished upon incubation with cPTIO, indicating that it is genuinely due to NO and further confirming the absence of endogenous fluorescence.
Fig. 7.
CLSM images showing NO localization in bean nodules. Plants were treated or not with 10 mM KNO3 for 4 d, but all of them were 30 d old when nodules were collected. Nodule sections were examined with identical settings. Lower panels are the bright-field images of the upper panels. Note the green fluorescence marking the presence of NO in the infected zone and its disappearance in nodule sections incubated with cPTIO. Scale bars=200 μm.
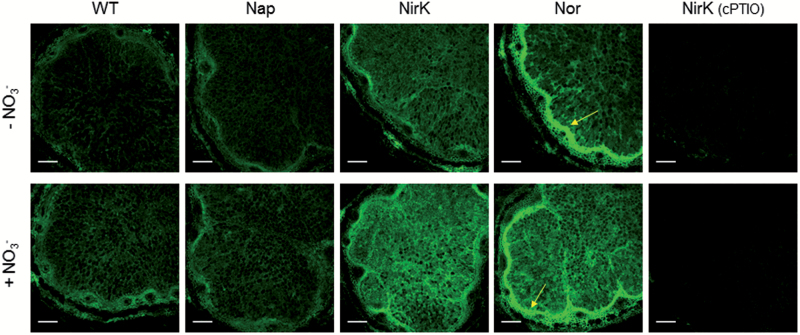
The fluorescence associated with NO was seen also in soybean nodules not treated with NO3−, but in this case the signal was localized both in the nodule parenchyma and in the infected zone (Fig. 8). The fluorescence intensity was similar in soybean nodules formed by the WT and napA strains, moderately higher in the infected zone of nodules of the nirK mutant, and even more intense in both regions of nodules of the norC mutant, especially in the parenchyma. Regarding the plants treated with NO3− for 6 d, the nodules formed by the WT or napA strains displayed similar signal intensity, comparable with nodules not given NO3− (Fig. 8). In contrast, the fluorescence signal increased with NO3− in nodules of the nirK and norC mutants, and was particularly conspicuous in the infected zone (Fig. 8). As occurred with bean nodules, the fluorescence was suppressed by incubation of soybean nodule sections with cPTIO, and this observation also confirmed the absence of background signal (Fig. 8). Notably, the indeterminate nodules of M. truncatula formed by an S. meliloti norB mutant appeared to have enhanced NO levels but results are difficult to compare due to the major differences in growth patterns between the two types of nodules and also because details of NO3− nutrition were not given (Meilhoc et al., 2013).
Fig. 8.
CLSM images showing NO localization in soybean nodules. Plants nodulated with the WT strain or with mutants defective in the enzymes Nap, NirK, or Nor were treated or not with 10 mM KNO3 for 6 d. All plants were 35 d old when nodules were collected. Nodule sections were examined with identical settings. Note the green fluorescence marking the presence of NO in the infected zone and in the nodule parenchyma (yellow arrows). The inhibition of the NO signal by cPTIO occurred in all nodule samples and the images of nodules lacking NirK are shown as an example. Scale bars=200 μm.
The observation of an intense NO production in the soybean nodule parenchyma is noteworthy (Fig. 8). This region contains high concentrations of antioxidants (Dalton et al., 1998) and co-localizes with the ODB that regulates the O2 flux into the infected zone (Minchin et al., 2008). Because the electron transport chain of nodule mitochondria can generate NO (Horchani et al., 2011), it is tempting to speculate that the observed increase in NO originates in the mitochondria as a result of the rapid O2 consumption in the nodule parenchyma linked to the operation of the ODB (Dalton et al., 1998). Surprisingly, we could not detect a comparable NO signal in bean nodules under any of the examined conditions (Fig. 7), suggesting metabolic differences between these two determinate nodules.
Inhibitor studies support a small contribution of plant nitrate reductase, but not of a nitric oxide synthase, activity to NO production in nodules
To gain information about the source of NO in nodules, we tested several known inhibitors of plant NR and animal NO synthase-like activity. Incubation of sections of NO3−-treated bean or soybean nodules with Na2WO4, an inhibitor of plant NR (Harper and Nicholas, 1978), slightly decreased the fluorescence intensity (Supplementary Fig. S6), indicating that this enzyme plays a secondary role in NO production compared with bacteroid denitrification. This conclusion is supported by the finding that the supply of NO3− had little impact on NO production in bean nodules (Fig. 7) or in soybean nodules formed by the WT or napA strains (Fig. 8).
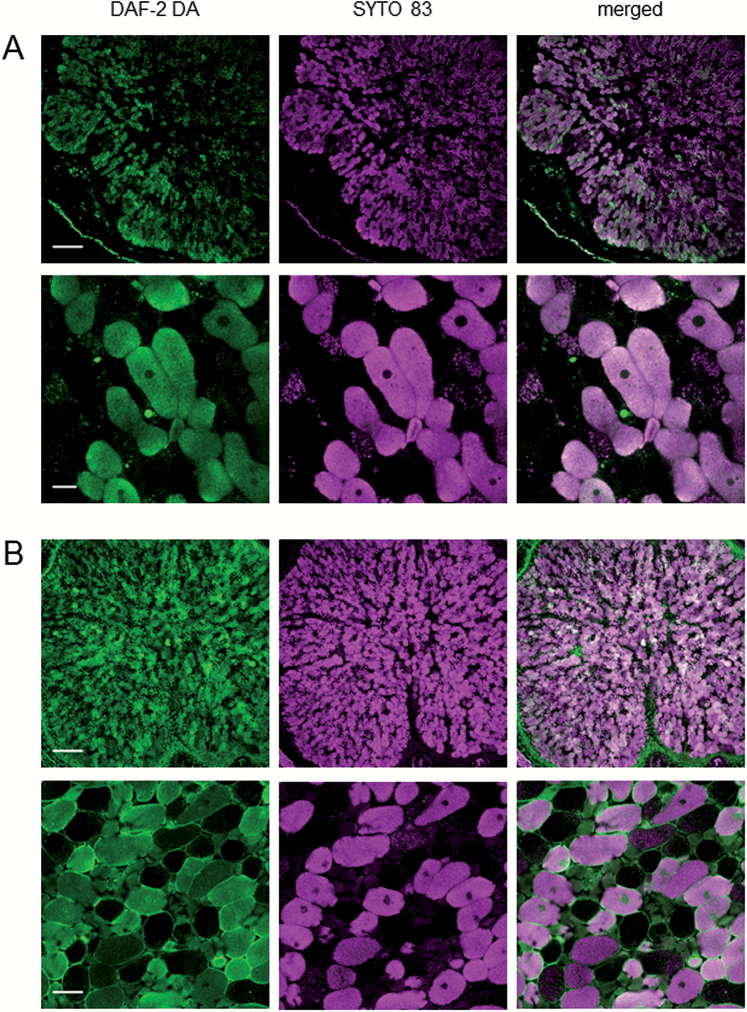
In contrast, the incubation of nodule sections with l-NNA or l-NMMA, which are inhibitors of animal NO synthases, had no effect on the signal (Supplementary Fig. S6). Because some previous observations support the presence of NO synthase-like activity in nodules (Cueto et al., 1996; Baudouin et al., 2006), we tested these inhibitors at different concentrations and time exposures (1–5 mM, 1–2 h) but none of them decreased the fluorescence signal. This inconsistency could be due to metabolic differences between indeterminate and determinate nodules, and strongly suggest that pathways other than plant NR and NO synthase-like enzymes are operative in nodules. These pathways may be independent of NO3− and especially operative in the infected zone. In bean nodules, the NO fluorescence signal was similarly intense without or with NO3− (Fig. 7), and in both bean and soybean nodules a large part of the signal co-localized with the infected cells in the absence or presence of NO3− (Fig. 9).
Fig. 9.
Co-localization of NO production (DAF-2 DA) and infected cells (SYTO 83) in (A) nodules of bean plants not treated with KNO3 and (B) nodules of soybean plants treated with KNO3 for 6 d. Similar results were obtained with bean nodules treated with KNO3 or with soybean nodules not treated with KNO3. SYTO 83 is a cell-permeant compound that exhibits intense fluorescence upon binding to nucleic acids. It intercalates in bacteroid DNA, marking the host infected cells. Scale bars=200 μm (A and B, upper panels); 25 μm (A, lower panels); 50 μm (B, lower panels).
EPR and fluorescence methods are complementary: EPR spectroscopy detects NO in vivo but is restricted to the infected zone, whereas fluorescent probes allow localization of the sites of potential NO production in nodule tissues
Our results of NO localization in bean and soybean nodules call into question a number of previous studies and reveal substantial discrepancies between EPR spectroscopy and fluorescent dyes. In the first place, the Lb2+NO observed in Lb preparations or nodule extracts (Maskall et al., 1977; Kanayama et al., 1990; Kanayama and Yamamoto, 1991) is artifactual because our EPR data show that Lb2+NO is absent from soybean nodules treated with NO3− but is generated in intact nodules not immediately frozen as well as in nodule extracts. The exception may be the extracts from soybean nodules subjected to flooding and other hypoxic conditions because the corresponding intact nodules have a reasonably good EPR signal, which indicates genuine formation of Lb2+NO probably as a result of activation of denitrification enzymes (Meakin et al., 2007; Sánchez et al., 2010). In the second place, EPR spectroscopy shows that NO is produced in the infected zone of soybean nodules formed by the nirK and norC mutants, but the fluorometric method revealed that NO is also generated in bean and soybean nodules with or without NO3−, conditions in which Lb2+NO is not detected by EPR. The finding that NO formation is artifactually enhanced in nodules by sectioning or incubation at 23 °C (Fig. 6), which are unavoidable steps for the fluorometric detection of NO, casts doubts on the validity of this method in quantitative terms. The factors that may induce NO production during sample processing are the mechanical wounding caused by the detaching and slicing of nodules, the disruption of the microoxic conditions prevailing in the infected zone, the access of cortical NO3− to the bacteroids, and the increase of denitrification enzyme activities in bacteroids at 23 °C. Additional potential pitfalls in the fluorometric detection of NO is that the DAF-2 DA probe reacts, at least in vitro, with oxidants such as peroxynitrite (Jourd’heuil, 2002) and antioxidants such as ascorbate and dehydroascorbate (Zhang et al., 2002), modifying the fluorescence intensity attributed to NO. Therefore, fluorescent dyes should be used with essential controls (cPTIO) and only to assess the potential of the various nodule tissues to generate NO. However, EPR spectroscopy of intact nodules should be the method of choice to detect NO in vivo. Nevertheless, EPR is based on the detection of the Lb2+NO complex and hence has the drawback that it only allows the relative quantification of NO within the infected zone.
In conclusion, reliable EPR measurements of intact bean and soybean nodules treated or not with NO3− show that Lb2+NO only accumulates in the infected zone of soybean nodules defective in NirK and Nor after 6 d with NO3−. These observations indicate that bacteroids are a major source of NO, that denitrification enzymes are required for NO homeostasis, and that Lb2+NO is not responsible for the inhibition of nitrogen fixation by NO3−. Our EPR data also reveal that Lb2+NO is artifactually generated if nodules are not examined immediately after detachment, and hence quantification of Lb2+NO in nodule extracts is not valid. On the other hand, fluorescent dyes with adequate controls are useful to localize relative NO production in the various nodule tissues. This method reveals NO formation in the infected zone of bean and soybean nodules and, interestingly, in the parenchyma of soybean nodules, suggesting a contribution of NO to the operation of the ODB. The NO-associated fluorescent signal was slightly decreased by inhibitors of NR but not of NO synthase, which is evidence of a rather minor contribution of plant NR to NO production in the presence of NO3− and suggests the existence of NO3−- and arginine-independent pathways for NO production in nodules.
Supplementary data
Supplementary data are available at JXB online.
Fig. S1. EPR spectra of purified soybean Lba in different oxidation and ligand-binding states.
Fig. S2. EPR spectra of bean Lba3+ and soybean Lba3+ at different temperatures.
Fig. S3. EPR spectrum of intact bean nodules showing the signals corresponding to rhombic non-heme Fe3+, Mn2+, and organic radical species.
Fig. S4. EPR spectra of intact nodules from bean plants treated or not with 10 mM KNO3.
Fig. S5. EPR spectra of soluble extracts from bean and soybean nodules.
Fig. S6. Effect of enzyme inhibitors on NO production in soybean nodules.
Acknowledgements
We thank Alba Hidalgo (Estación Experimental del Zaidín) for technical assistance, and Raquel Valderrama and Juan B. Barroso (Universidad de Jaén) for helpful advice on NO localization with fluorescent dyes. We are also grateful to three anonymous reviewers for helpful comments on the manuscript. CLSM studies were performed at the microscopy facility of Centro de Investigación Biomédica de Aragón (Instituto Aragonés de Ciencias de la Salud, Zaragoza). This work was supported by grants AGL2014-53717-R (to MB), CTQ2015-64486-R (to JIM), and AGL2013-45087-R (to MJD) from the Ministry of Economy and Competitiveness. These grants were co-funded by Fondos Europeos de Desarrollo Regional (FEDER).
Abbreviations
- DAF-2 DA
4,5-diaminofluorescein diacetate
- Lb
leghemoglobin
- Lb2+NO
nitrosyl-leghemoglobin
- Nap
bacteroid periplasmic nitrate reductase
- NirK
bacteroid respiratory nitrite reductase
- NO
nitric oxide
- Nor
bacteroid nitric oxide reductase
- NOS
nitric oxide synthase
- NiR
plant nitrite reductase
- NR
plant nitrate reductase
- ODB
oxygen diffusion barrier.
References
- Appleby CA. 1984. Leghemoglobin and Rhizobium respiration. Annual Review of Plant Physiology 35, 443–478. [Google Scholar]
- Arrese-Igor C, Gordon AJ, Minchin FR, Denison RF. 1998. Nitrate entry and nitrite formation in the infected region of soybean nodules. Journal of Experimental Botany 49, 41–48. [Google Scholar]
- Baudouin E, Pieuchot L, Engler G, Pauly N, Puppo A. 2006. Nitric oxide is formed in Medicago truncatula–Sinorhizobium meliloti functional nodules. Molecular Plant-Microbe Interactions 19, 970–975. [DOI] [PubMed] [Google Scholar]
- Becana M, Minchin FR, Sprent JI. 1989. Short-term inhibition of legume N2 fixation by nitrate: I. Nitrate effects on nitrate-reductase activities of bacteroids and nodule cytosol. Planta 180, 40–45. [DOI] [PubMed] [Google Scholar]
- Becana M, Klucas RV. 1990. Enzymatic and nonenzymatic mechanisms for ferric leghemoglobin reduction in legume root nodules. Proceedings of the National Academy of Sciences, USA 87, 7295–7299. [DOI] [PMC free article] [PubMed] [Google Scholar]
- Bueno E, Mesa S, Bedmar EJ, Richardson DJ, Delgado MJ. 2012. Bacterial adaptation of respiration from oxic to microoxic and anoxic conditions: redox control. Antioxidants & Redox Signaling 16, 819–852. [DOI] [PMC free article] [PubMed] [Google Scholar]
- Calvo-Begueria L, Cuypers B, Van Doorslaer S, Abbruzzetti S, Bruno S, Berghmans H, Dewilde S, Ramos J, Viappiani C, Becana M. 2017. Structure and ligand binding kinetics of non-symbiotic hemoglobins from the model legume Lotus japonicus. Frontiers in Plant Science 8, 407. [DOI] [PMC free article] [PubMed] [Google Scholar]
- Cam Y, Pierre O, Boncompagni E, Hérouart D, Meilhoc E, Bruand C. 2012. Nitric oxide (NO): a key player in the senescence of Medicago truncatula root nodules. New Phytologist 196, 548–560. [DOI] [PubMed] [Google Scholar]
- Cueto M, Hernández-Perera O, Martín R, Bentura ML, Rodrigo J, Lamas S, Golvano MP. 1996. Presence of nitric oxide synthase activity in roots and nodules of Lupinus albus. FEBS Letters 398, 159–164. [DOI] [PubMed] [Google Scholar]
- Dalton DA, Joyner SL, Becana M, Iturbe-Ormaetxe I, Chatfield JM. 1998. Antioxidant defenses in the peripheral cell layers of legume root nodules. Plant Physiology 116, 37–43. [DOI] [PMC free article] [PubMed] [Google Scholar]
- del Giudice J, Cam Y, Damiani I, Fung-Chat -F, Meilhoc E, Bruand C, Brouquisse R, Puppo A, Boscari A. 2011. Nitric oxide is required for an optimal establishment of the Medicago truncatula–Sinorhizobium meliloti symbiosis. New Phytologist 191, 405–417. [DOI] [PMC free article] [PubMed] [Google Scholar]
- Doetschman DC, Utterback SG. 1981. Electron paramagnetic resonance study of nitrosylhemoglobin and its chemistry in single crystals. Journal of the American Chemical Society 103, 2847–2852. [Google Scholar]
- Fukudome M, Calvo-Begueria L, Kado T, et al. . 2016. Hemoglobin LjGlb1-1 is involved in nodulation and regulates the level of nitric oxide in the Lotus japonicus–Mesorhizobium loti symbiosis. Journal of Experimental Botany 67, 5275–5283. [DOI] [PMC free article] [PubMed] [Google Scholar]
- Harper JE, Nicholas JC. 1978. Nitrogen metabolism of soybeans: I. Effect of tungstate on nitrate utilization, nodulation, and growth. Plant Physiology 62, 662–664. [DOI] [PMC free article] [PubMed] [Google Scholar]
- Hichri I, Meilhoc E, Boscari A, Bruand C, Frendo P, Brouquisse R. 2016. Nitric oxide: jack-of-all-trades of the nitrogen-fixing symbiosis?Advances in Botanical Research 77, 193–218. [Google Scholar]
- Horchani F, Prévot M, Boscari A, et al. . 2011. Both plant and bacterial nitrate reductases contribute to nitric oxide production in Medicago truncatula nitrogen-fixing nodules. Plant Physiology 155, 1023–1036. [DOI] [PMC free article] [PubMed] [Google Scholar]
- Jourd’heuil D. 2002. Increased nitric oxide-dependent nitrosylation of 4,5-diaminofluorescein by oxidants: implications for the measurement of intracellular nitric oxide. Free Radical Biology and Medicine 33, 676–684. [DOI] [PubMed] [Google Scholar]
- Kanayama Y, Watanabe I, Yamamoto Y. 1990. Inhibition of nitrogen fixation in soybean plants supplied with nitrate. I. Nitrite accumulation and formation of nitrosylleghemoglobin in nodules. Plant and Cell Physiology 31, 341–346. [Google Scholar]
- Kanayama Y, Yamamoto Y. 1991. Formation of nitrosylleghemoglobin in nodules of nitrate-treated cowpea and pea plants. Plant and Cell Physiology 32, 19–24. [Google Scholar]
- Kato K, Kanahama K, Kanayama Y. 2010. Involvement of nitric oxide in the inhibition of nitrogenase activity by nitrate in Lotus root nodules. Journal of Plant Physiology 167, 238–241. [DOI] [PubMed] [Google Scholar]
- Lee K, Shearman LL, Erickson BK, Klucas RV. 1995. Ferric leghemoglobin in plant-attached leguminous nodules. Plant Physiology 109, 261–267. [DOI] [PMC free article] [PubMed] [Google Scholar]
- Maiti D, Sarkar TS, Ghosh S. 2012. Detection of S-nitrosothiol and nitrosylated proteins in Arachis hypogaea functional nodule: response of the nitrogen-fixing symbiont. PLoS One 7, e45526. [DOI] [PMC free article] [PubMed] [Google Scholar]
- Maskall CS, Gibson JF, Dart PJ. 1977. Electron-paramagnetic-resonance studies of leghaemoglobins from soya-bean and cowpea root nodules. Identification of nitrosyl-leghaemoglobin in crude leghaemoglobin preparations. Biochemical Journal 167, 435–445. [DOI] [PMC free article] [PubMed] [Google Scholar]
- Matamoros MA, Loscos J, Coronado MJ, Ramos J, Sato S, Testillano PS, Tabata S, Becana M. 2006. Biosynthesis of ascorbic acid in legume root nodules. Plant Physiology 141, 1068–1077. [DOI] [PMC free article] [PubMed] [Google Scholar]
- Mathieu C, Moreau S, Frendo P, Puppo A, Davies MJ. 1998. Direct detection of radicals in intact soybean nodules: presence of nitric oxide–leghemoglobin complexes. Free Radical Biology and Medicine 24, 1242–1249. [DOI] [PubMed] [Google Scholar]
- Meakin GE, Bueno E, Jepson B, Bedmar EJ, Richardson DJ, Delgado MJ. 2007. The contribution of bacteroidal nitrate and nitrite reduction to the formation of nitrosylleghaemoglobin complexes in soybean root nodules. Microbiology 153, 411–419. [DOI] [PubMed] [Google Scholar]
- Meilhoc E, Blanquet P, Cam Y, Bruand C. 2013. Control of NO level in rhizobium–legume root nodules: not only a plant globin story. Plant Signaling and Behavior 8, e25923. [DOI] [PMC free article] [PubMed] [Google Scholar]
- Melo PM, Silva LS, Ribeiro I, Seabra AR, Carvalho HG. 2011. Glutamine synthetase is a molecular target of nitric oxide in root nodules of Medicago truncatula and is regulated by tyrosine nitration. Plant Physiology 157, 1505–1517. [DOI] [PMC free article] [PubMed] [Google Scholar]
- Minchin FR, James EK, Becana M. 2008. Oxygen diffusion, production of reactive oxygen and nitrogen species, and antioxidants in legume nodules. In: Dilworth MJ, James EK, Sprent JI, Newton WE, eds. Nitrogen-fixing leguminous symbioses. Nitrogen fixation: origins, applications, and research progress, Vol. 7 Dordrecht: Springer, 321–362. [Google Scholar]
- Mur LA, Mandon J, Cristescu SM, Harren FJ, Prats E. 2011. Methods of nitric oxide detection in plants: a commentary. Plant Science 181, 509–519. [DOI] [PubMed] [Google Scholar]
- Nagata M, Murakami E, Shimoda Y, Shimoda-Sasakura F, Kucho K, Suzuki A, Abe M, Higashi S, Uchiumi T. 2008. Expression of a class 1 hemoglobin gene and production of nitric oxide in response to symbiotic and pathogenic bacteria in Lotus japonicus. Molecular Plant-Microbe Interactions 21, 1175–1183. [DOI] [PubMed] [Google Scholar]
- Navascués J, Pérez-Rontomé C, Gay M, Marcos M, Yang F, Walker FA, Desbois A, Abián J, Becana M. 2012. Leghemoglobin green derivatives with nitrated hemes evidence production of highly reactive nitrogen species during aging of legume nodules. Proceedings of the National Academy of Sciences, USA 109, 2660–2665. [DOI] [PMC free article] [PubMed] [Google Scholar]
- Sainz M, Calvo-Begueria L, Pérez-Rontomé C, Wienkoop S, Abián J, Staudinger C, Bartesaghi S, Radi R, Becana M. 2015. Leghemoglobin is nitrated in functional legume nodules in a tyrosine residue within the heme cavity by a nitrite/peroxide-dependent mechanism. The Plant Journal 81, 723–735. [DOI] [PMC free article] [PubMed] [Google Scholar]
- Sánchez C, Gates AJ, Meakin GE, Uchiumi T, Girard L, Richardson DJ, Bedmar EJ, Delgado MJ. 2010. Production of nitric oxide and nitrosylleghemoglobin complexes in soybean nodules in response to flooding. Molecular Plant-Microbe Interactions 23, 702–711. [DOI] [PubMed] [Google Scholar]
- Sasakura F, Uchiumi T, Shimoda Y, Suzuki A, Takenouchi K, Higashi S, Abe M. 2006. A class 1 hemoglobin gene from Alnus firma functions in symbiotic and nonsymbiotic tissues to detoxify nitric oxide. Molecular Plant-Microbe Interactions 19, 441–450. [DOI] [PubMed] [Google Scholar]
- Shimoda Y, Nagata M, Suzuki A, Abe M, Sato S, Kato T, Tabata S, Higashi S, Uchiumi T. 2005. Symbiotic rhizobium and nitric oxide induce gene expression of non-symbiotic hemoglobin in Lotus japonicus. Plant and Cell Physiology 46, 99–107. [DOI] [PubMed] [Google Scholar]
- Shimoda Y, Shimoda-Sasakura F, Kucho K, Kanamori N, Nagata M, Suzuki A, Abe M, Higashi S, Uchiumi T. 2009. Overexpression of class 1 plant hemoglobin genes enhances symbiotic nitrogen fixation activity between Mesorhizobium loti and Lotus japonicus. The Plant Journal 57, 254–263. [DOI] [PubMed] [Google Scholar]
- Sprent JI, Giannakis C, Wallace W. 1987. Transport of nitrate and calcium into legume root nodules. Journal of Experimental Botany 38, 1121–1128. [Google Scholar]
- Sturms R, DiSpirito AA, Hargrove MS. 2011. Plant and cyanobacterial hemoglobins reduce nitrite to nitric oxide under anoxic conditions. Biochemistry 50, 3873–3878. [DOI] [PubMed] [Google Scholar]
- Trinchant JC, Rigaud J. 1982. Nitrite and nitric oxide as inhibitors of nitrogenase from soybean bacteroids. Applied and Environmental Microbiology 44, 1385–1388. [DOI] [PMC free article] [PubMed] [Google Scholar]
- Tsubaki M, Hiwatashi A, Ichikawa Y, Hori H. 1987. Electron paramagnetic resonance study of ferrous cytochrome P-450scc–nitric oxide complexes: effects of cholesterol and its analogues. Biochemistry 26, 4527–4534. [DOI] [PubMed] [Google Scholar]
- Zhang X, Kim WS, Hatcher N, Potgieter K, Moroz LL, Gillette R, Sweedler JV. 2002. Interfering with nitric oxide measurements. 4,5-diaminofluorescein reacts with dehydroascorbic acid and ascorbic acid. Journal of Biological Chemistry 277, 48472–48478. [DOI] [PubMed] [Google Scholar]
Associated Data
This section collects any data citations, data availability statements, or supplementary materials included in this article.


