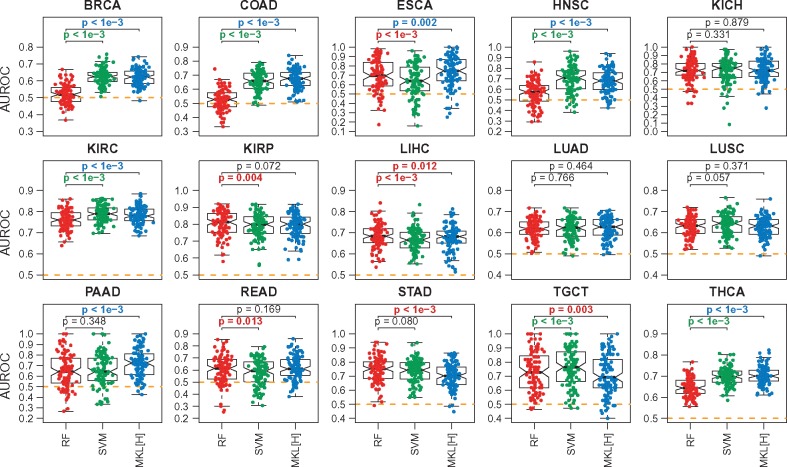
Fig. 2.
Predictive performances of RF, SVM and MKL on the Hallmark gene sets (MKL[H]) on 15 datasets constructed from TCGA cohorts for the first set of experiments E1. The box-and-whisker plots compare the AUROC values of the algorithms over 100 replications. SVM and MKL[H] are compared against RF using a two-tailed paired t-test to check whether there is a significant difference between their performances. For P-value results, red: RF is better; green: SVM is better; blue: MKL[H] is better; black: no difference. The orange dashed lines show the baseline performance level (i.e. AUROC = 0.5)

