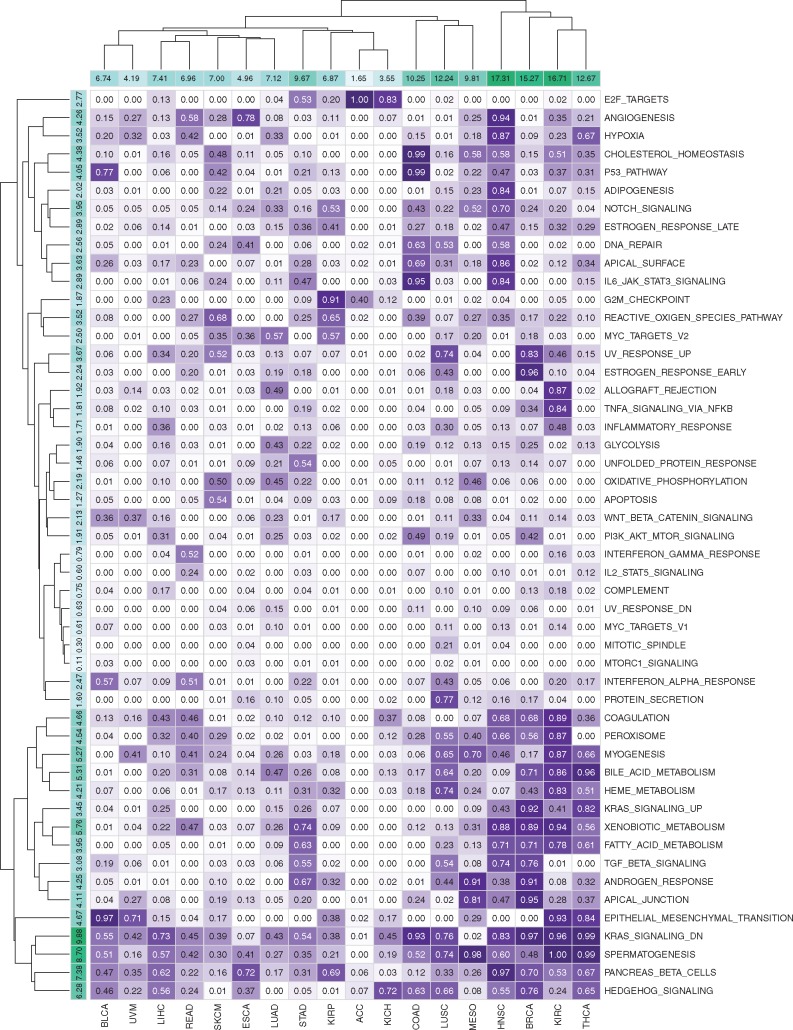
Fig. 5.
Selection frequencies of 50 gene sets in the Hallmark collection for 18 datasets in the second set of experiments E2. Rows and columns are clustered using hierarchical clustering with Euclidean distance and complete linkage functions. Column sums of selection frequencies are reported to identify datasets that use higher number of gene sets on the average. Row sums of selection frequencies are reported to identify frequently selected gene sets across different datasets

