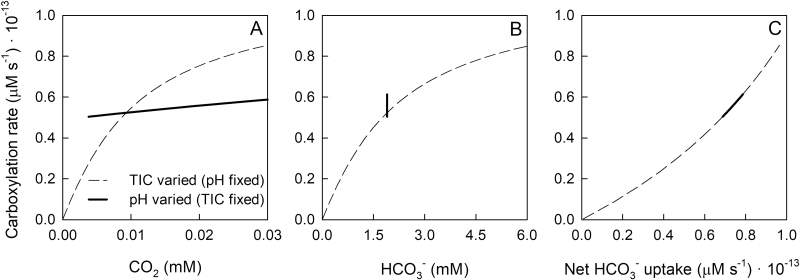
Fig. 2.
Calculated carboxylation rates obtained from model simulations for T. erythraeum IMS101 as a function of external CO2 (A) and HCO3– (B) concentrations, with TIC (i.e. HCO3–) varied at a fixed pH=8.15 (dashed lines) and pH varied at a fixed HCO3–=1.9 mM (solid lines). Carboxylation rates are also plotted against the net HCO3– uptake rate (C), where HCO3– and CO2 leakage rates were subtracted from the rate of gross HCO3– transport.

