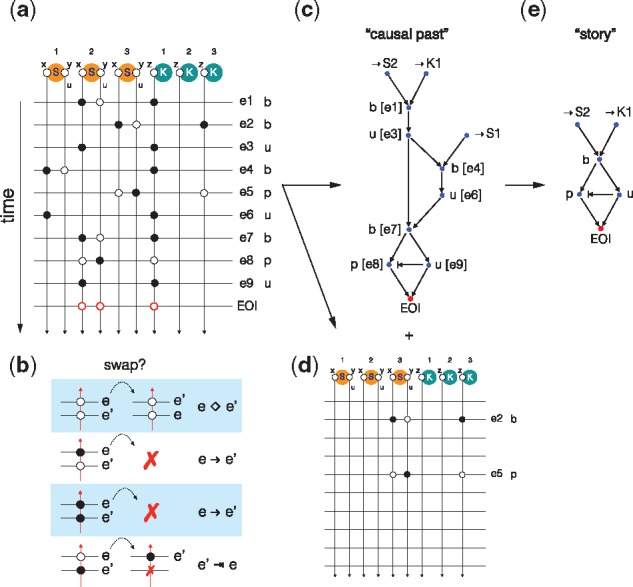
Fig. 4.

Causal analysis of event traces. Panel (a): The representation of a trace in terms of ‘worldlines’ that record the modifications and tests at each site for each event in the trace. Panel (b): Schematic of allowed moves and annotations emitted when swapping the order of adjacent events for a particular wordline (i.e. site in the model). See text for details. Panel (c): The causal past of the EOI reconstructed from the trace representation in panel (a) following the instructions in panel (b). Panel (d): The events that had no bearing on the EOI. Panel (e): Minimization of the causal past shown in panel (c) by eliminating cycles that return to an equivalent system state from the point of view of the EOI
