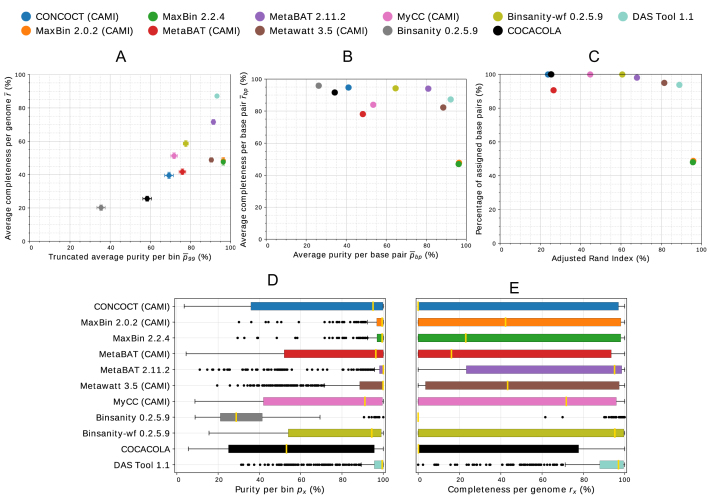
Figure 2:
Assessment of genome bins reconstructed from CAMI's high-complexity challenge dataset by different binners. Binner versions participating in CAMI are indicated in the legend in parentheses. (A) Average purity per bin (xaxis), average completeness per genome (yaxis), and respective standard errors (bars). As in the CAMI challenge, we report  with 1% of the smallest bins predicted by each program removed. (B) Average purity per base pair (xaxis) and average completeness per base pair (yaxis). (C)ARI per base pair (xaxis) and percentage of assigned base pairs (yaxis). (D and E) Box plots of purity per bin and completeness per genome, respectively.

