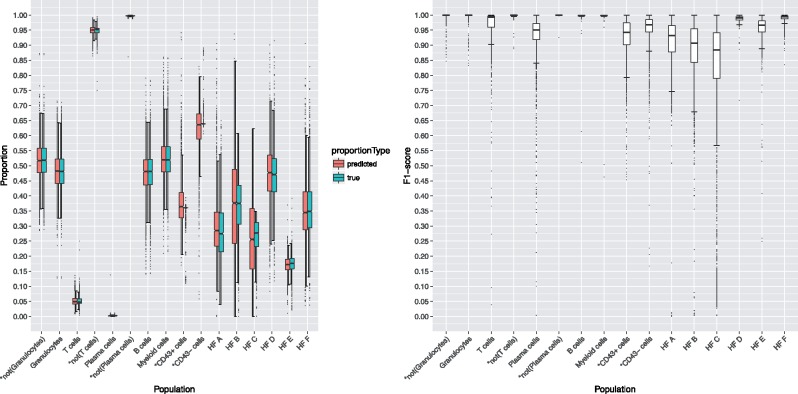
Fig. 4.
Results on the Mice dataset using one prototype. Left: True and predicted cell frequencies for each population. Right: F1-scores for each population (2665 samples). Outliers are shown as single dots. Populations HFA to HFF stand for Hardy-Fraction A to F (explained in Supplementary Table S3). Populations denoted with an asterisk are non-biological (technical) populations

