
Fig. 6.
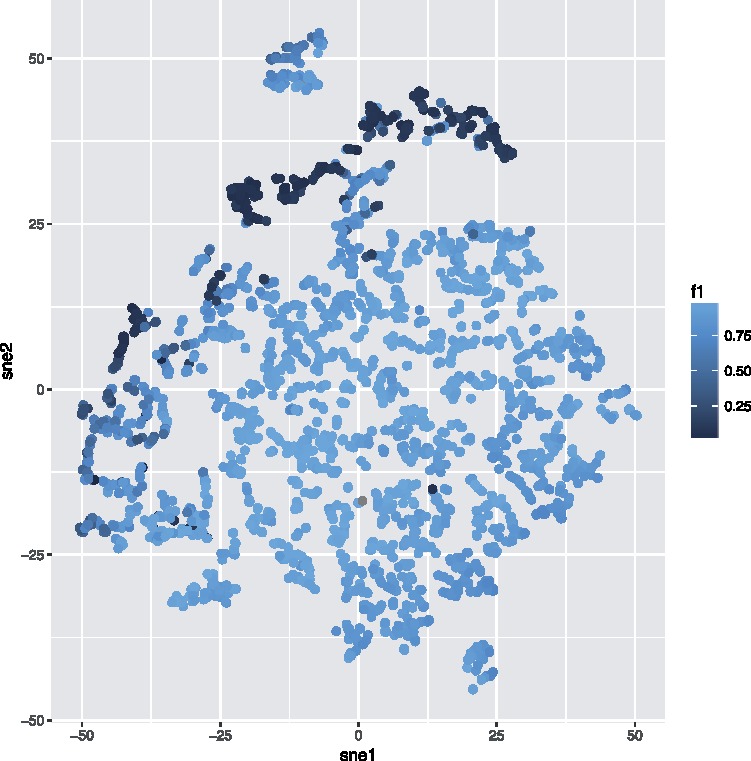
t-SNE projection of Mice densities (HFC population) from one channel, colored by F1-score according to predictions using np = 1. Samples with low performance cluster together
Official websites use .gov
A
.gov website belongs to an official
government organization in the United States.
Secure .gov websites use HTTPS
A lock (
) or https:// means you've safely
connected to the .gov website. Share sensitive
information only on official, secure websites.
t-SNE projection of Mice densities (HFC population) from one channel, colored by F1-score according to predictions using np = 1. Samples with low performance cluster together