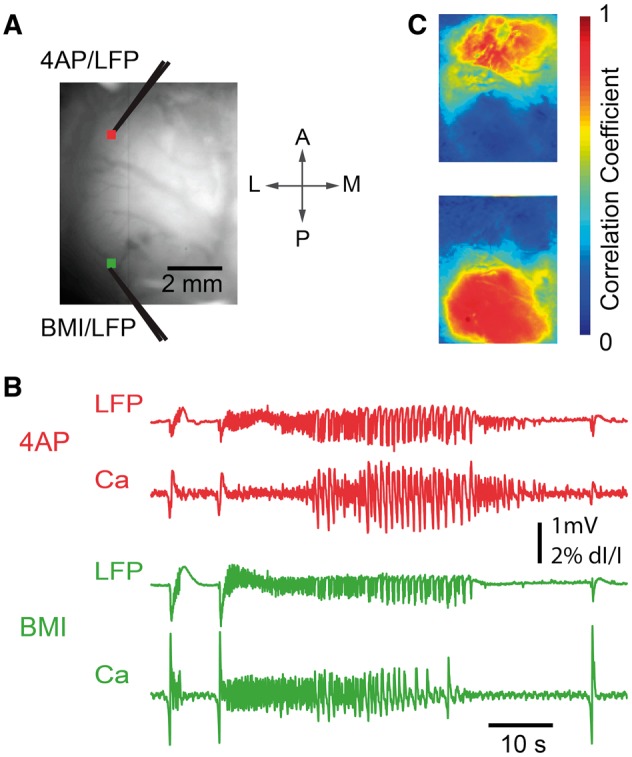
Figure 7.

Wide-field calcium imaging of the two-focus epileptic network. (A) Wide field imaging setup of the two-focus experiment. The cranial window extended from ∼1 mm caudal to bregma to ∼1 mm rostral to lambda, and was placed 1–6 mm from the midline. Distance between foci varied from 3.8 to 6.3 mm (mean 5.1 mm). The field of view shows the location of 4-AP and BMI injection sites. Glass electrodes were used for both microinjection and LFP recording. Two 3 × 3 pixel regions of interest were selected close to the 4-AP injection site (red) and BMI injection site (green), from which the calcium trace was drawn in (B) and selected as the seed trace for cross-correlation. (B) LFP (top) and Ca signals (bottom) recorded from the 4-AP (red, top) and BMI (green, bottom) injection sites, respectively. Note that although the ictal events begin simultaneously, the evolution of morphology of the ictal waveform is quite different as recorded both with the LFP and the calcium imaging. (C) Seed-initiated correlation coefficient maps (seed traces shown in B), with correlation studied for the entire set of eight rats and 41 seizures. Top: Correlation map of a sample seizure in which the Ca signal recorded from the 4-AP injection site region of interest was used as the seed trace. Mean and SD of the correlation coefficients calculated from a 1 mm × 1 mm brain region surrounding the 4-AP injection site was 0.83 ± 0.15, and for BMI site 0.31 ± 0.21. The difference was highly significant (Wilcoxon rank-sum test, P ≪ 0.001). Bottom: Correlation map of the same seizure, using the Ca signal recorded from the BMI injection site region of interest as the seed trace. Correlation for the BMI site was 0.92 ± 0.08, and for the 4-AP site 0.34 ± 0.23, again significantly different (Wilcoxon rank-sum test, P ≪ 0.001).
