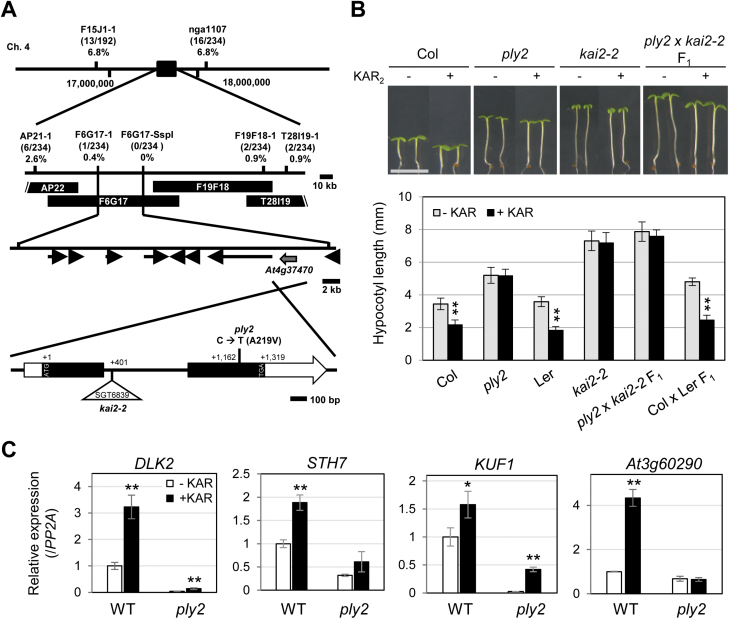
Fig. 1.
Map-based cloning of PLY2. (A) Schematic diagram of map-based cloning. The PLY2 locus was initially mapped between the AP22 and T28I19-1 markers on chromosome 4. Fine-mapping narrowed the location to between the F6G17-1 and F6G17-SspI markers. The numbers in parenthesis indicate the numbers of recombinant chromatids. Candidate gene sequencing revealed that a substitution of 656th C to T occurred in the At4g37470 gene of the ply2 mutant, predicted to change the 219th alanine to valine (Ala219Val). The triangle indicates the transposon-insertion site in the kai2-2 mutant. (B) Complementation test between ply2 and kai2-2. The F1 plants of ply2 and kai2-2 were analysed for hypocotyl growth. The seedlings were sown on MS media and grown under short-day conditions (10/14 h light/dark) for 5 d with or without 10 μM KAR2 (KAR). The images show representative seedlings; scale bar, 5 mm. The graph shows the mean hypocotyl length (±SD) of at least 12 seedlings (n=12–18). Significant differences compared to the mock-treated control were determined using Student’s t-test; **P<0.01. (C) KAR-responsive gene expression in the ply2 mutant. Seedlings were grown under continuous light for 5 d. After treatment with either 10 μM KAR2 (+KAR) or 0.01% DMSO as control (–KAR) for 3 h, total RNAs were extracted and subjected to real-time RT-PCR analysis. The data are mean (±SD) values of relative expression level from experimental replicates (n=3), normalized to the level of PP2A expression in mock-treated wild-type (Col). Significant differences from the mock-treated control were determined using Student’s t-test; **P<0.01, *P<0.05.

