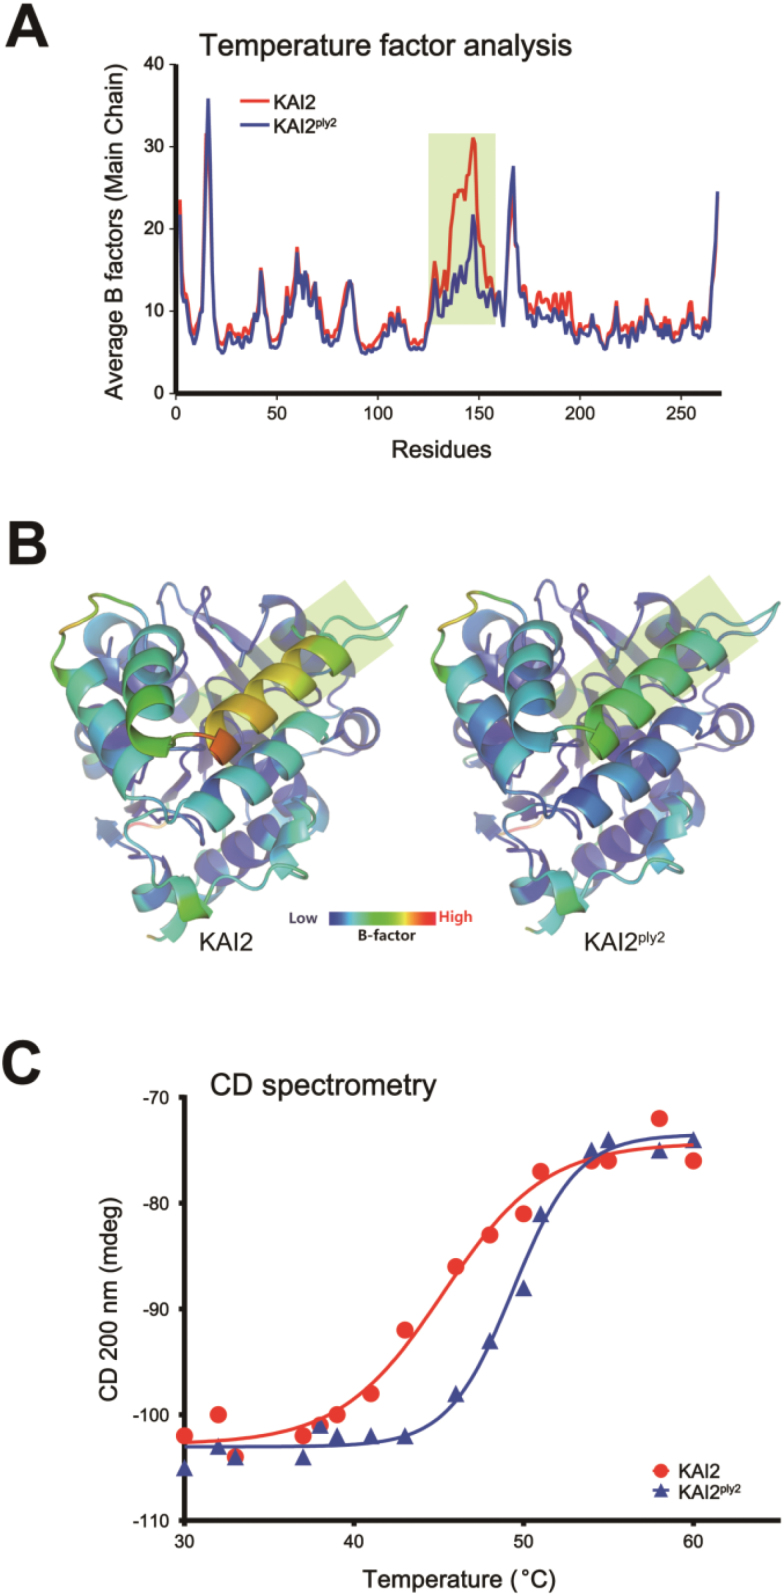
Fig. 9.
Comparison of thermal stability between KAI2 and KAI2ply2. (A) B-factor analysis of protein crystals for KAI2 and KAI2ply2. The residues ranging from 120–150 (highlighted) of KAI2 showed higher B factor values compared to those of KAI2ply2. (B) Ribbon diagram of B-factors of KAI2 and KAI2ply2. Note that the residues showing clear differences between KAI2 and KAI2 ply2 in (A) correspond to the helix of the cap domains (shaded areas). (C) Circular dichroism (CD) spectrometry assay. The melting temperature (Tm) of KAI2 is 45 °C and for KAI2ply2 it is 50 °C.

