
Fig. 2.
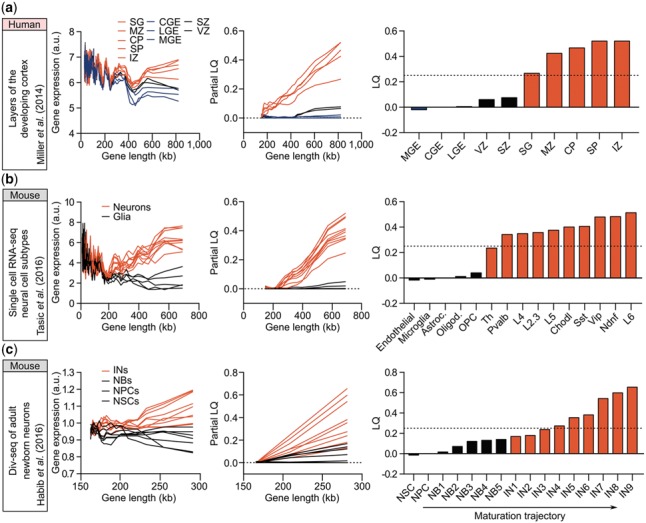
LONGO output of neuronal differentiation and maturation during development. From left to right, reference for input data, rolling media of gene expression versus length (200 gene bins, 40 gene step), partial LQ and final LQ. (a) Layers of the developing human cortex (Miller et al., 2014): ganglionic eminences (MGE, LGE, CGE; blue); ventricular zones (VZ and SVZ; black); and post-mitotic zones (SG, MZ, CP, SP and IZ; red). (b) scRNA-seq neural cell subtypes from mouse visual cortex (Tasic et al., 2016): glial cells (endothelial cells, microglia, astrocytes, oligodendrocytes and OPCs) shown in black; neuronal subtypes (Th, Pvalb, L4, L2.3, L5, Chodl, Sst, Vip, Ndnf and L6) shown in red. (c) Div-seq of adult newborn neurons in the neurogenic niche of mouse hippo-campus (Habib et al., 2016): neural stem cells (NSCs), neural progenitor cells (NPCs) and neuroblasts (NBs) shown in black; immature neurons (IN) shown in red. Samples are numbered according to their maturity (Habib et al., 2016)