
Fig. 1.
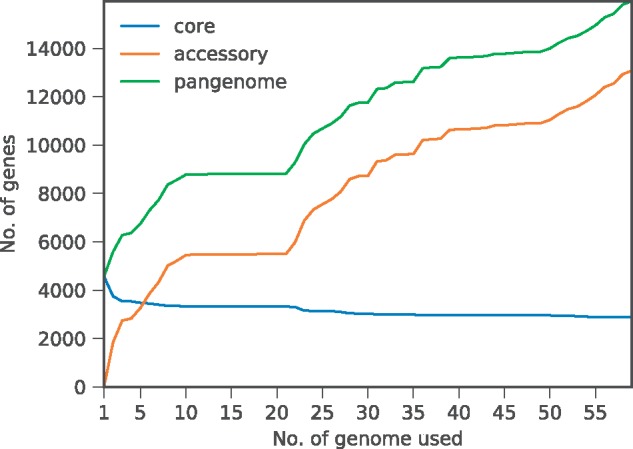
Growth rates of the pan-genome sizes, core gene cluster and accessory gene cluster numbers with the increasing number of E. coli genomes. The blue, orange and green lines, respectively, represent core-, accessory- and pan-genome sizes
Official websites use .gov
A
.gov website belongs to an official
government organization in the United States.
Secure .gov websites use HTTPS
A lock (
) or https:// means you've safely
connected to the .gov website. Share sensitive
information only on official, secure websites.
Growth rates of the pan-genome sizes, core gene cluster and accessory gene cluster numbers with the increasing number of E. coli genomes. The blue, orange and green lines, respectively, represent core-, accessory- and pan-genome sizes