
Fig. 2.
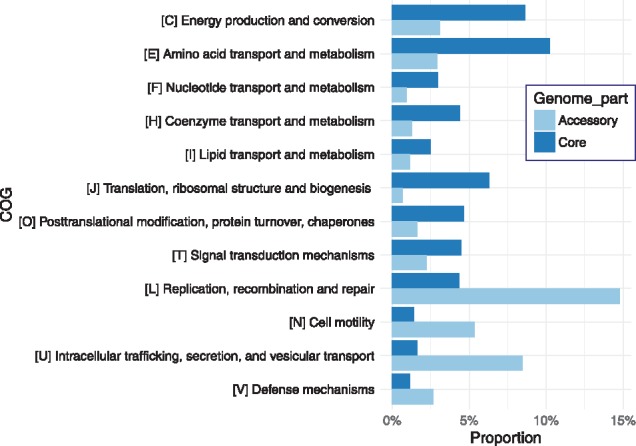
Differences in the COGs functional distributions between the core- and accessory-genomes. COG percentages were estimated by dividing COG numbers by the total gene cluster numbers in either the core- or accessory-genome. Only COGs differing by at least 2-fold between the core and accessory parts were included