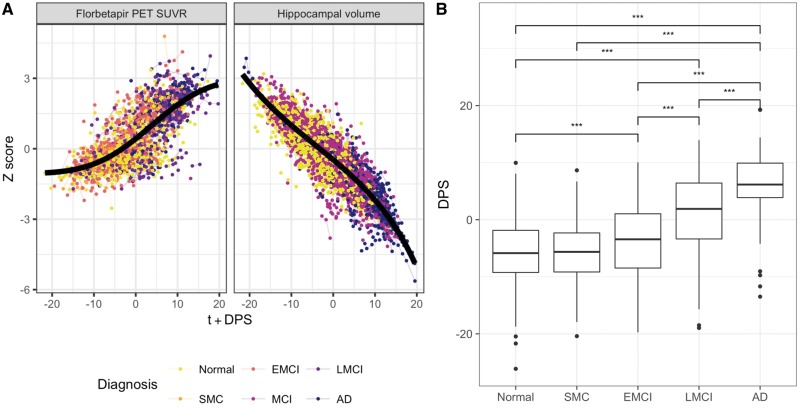
Figure 2.
Disease progression modelling results. (A) Long-term progression curves for two Alzheimer’s disease biomarkers. Every point in the plot represents a biomarker measurement; longitudinal data from the same subject are connected by lines. The subjects’ clinical diagnosis at the initial PET scan is colour-coded. The x-axis shows the time from study entry plus the estimated DPS, values on the y-axis are the Z-score normalized individual biomarker measurements: florbetapir PET SUVR and intracranial-volume-normalized bilateral hippocampal volume. (B) Disease progression scores stratified by diagnosis at baseline PET scan. The y-axis shows the DPS and the x-axis corresponds to different diagnostic groups of increasing severity from left (Normal) to right (Alzheimer’s disease). Each box shows the DPS distribution for the corresponding diagnostic group. Annotations represent the level of statistical significance for pairwise tests, after correction for multiple comparisons (*** P < 0.001). EMCI = early MCI; LMCI = late MCI; SMC = subjective memory complaints.

