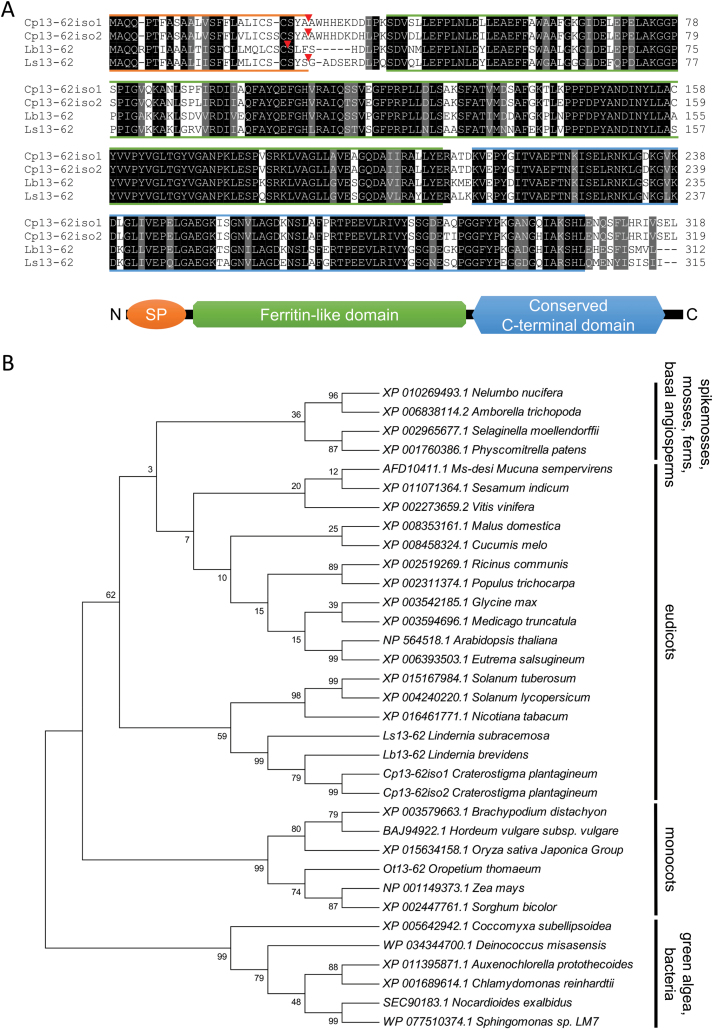
Fig. 1.
Alignment of Craterostigma plantagineum, Lindernia brevidens, and Lindernia subracemosa 13-62 amino acid sequences and phylogenetic analysis of selected 13-62 protein homologs. (A) Alignment of the predicted 13-62 amino acid sequences. Identical (black) and conserved (grey) amino acids are indicated. Coloured lines are used to show the different protein domains. Orange: predicted signal peptide (SP); red triangles indicate the predicted SP cleavage site; green: ferritin-like domain (pfam13668); blue: conserved C-terminal domain. (B) phylogenetic analysis of 13-62 protein homologs. The percentage of trees in which the associated taxa clustered together is shown next to the branches. Phylogenetic analysis was performed using the maximum likelihood method based on the JTT matrix-based model (Jones et al., 1992). The tree with the highest log likelihood is shown. (This figure is available in colour at JXB online.)

