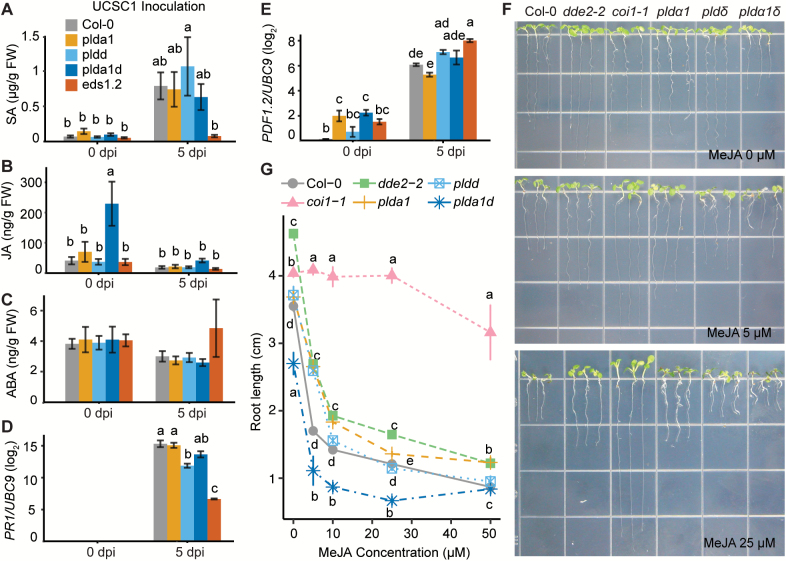
Fig. 6.
Impact of the pldα1 and pldδ single and double mutations on the levels and signaling of SA and JA before and after powdery mildew infection. (A–C) Levels of the plant hormones SA (A), JA (B), and ABA (C) were measured by LC-MS/MS in leaves of 6-week-old plants of the indicated genotypes prior to (0 dpi) and post- (5 dpi) Gc UCSC1 inoculation. Notably, before inoculation, the JA level of pldα1δ was higher than that of the two single mutants and was reduced by ~4-fold at 5 dpi. Bars represent the mean ±SEM of three independent experiments combined (n=3 for each experiment). (D, E) Log2-fold changes of PR1 (D) or PDF1.2 (E) relative to UBC9 encoding ubiquitin conjugating enzyme 9. Bars represent the mean ±SEM of three biological replicates. (F) Representative pictures showing 10-day-old seedlings of the indicated genotypes grown on MS-agar medium without or with 5 μM and 25 μM MeJA. (G) Dose–response curve of root growth of the indicated genotypes upon MeJA treatment. Root lengths of 10-day-old seedlings growing on MS-agar medium supplemented with exogenous MeJA at 0, 5, 10, 25, or 50 μM were measured and are presented as the mean ±SEM at each MeJA dosage. The line graph shows combined data from two independent experiments (n >15 for each experiment). Different lower case letters indicate statistically different groups (P<0.05) as determined by multiple comparisons using one-way ANOVA, followed by Tukey’s HSD test.

