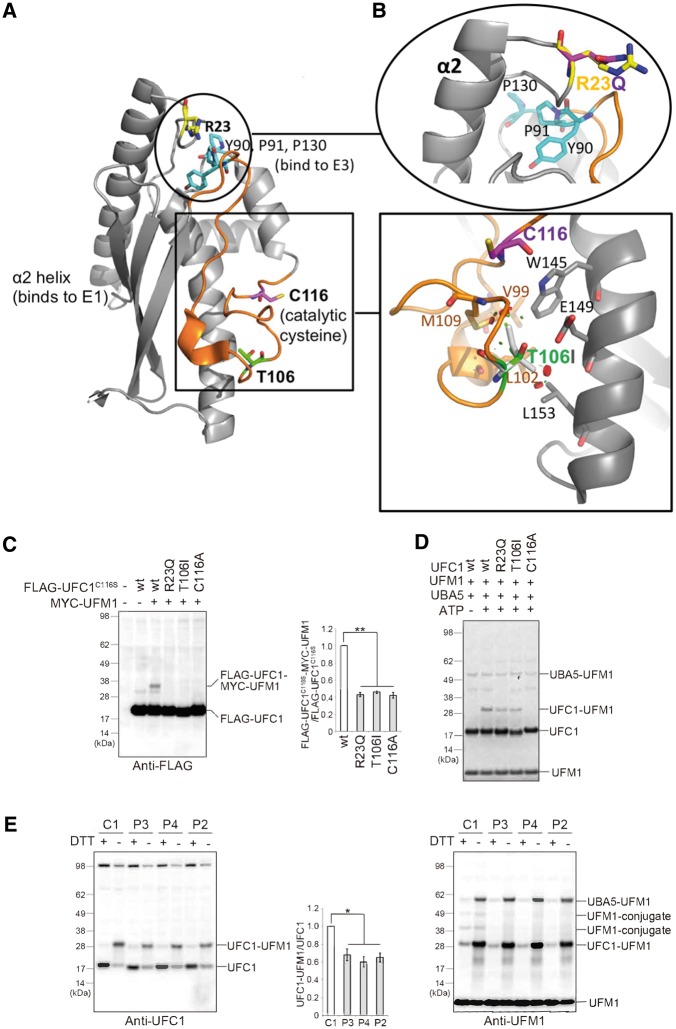
Figure 4.
Hypomorphic effect of UFC1 mutants on the UFM system. (A) Localization of the key binding sites on UFC1. Binding sites for E1 and E3 are indicated. Boxed region shows the active site, and the coiled region for binding site to UFM1 is coloured in orange. The mutated residues Arg23 and Thr106 are highlighted in yellow and green, respectively. Encircled region shows the proximity of R23 with regions involved in binding to E1 (helix α2) and E3 (Tyr90, Pro91, Pro130; cyan). (B) Bottom: Magnification of Thr106. Residues involved in hydrophobic or polar interactions with Thr106 are shown as stick models. Colouring as in A, except for the mutant Ile106, which is shown as light grey stick model, with positions of minor clashes indicated as discs. Top: Magnification of Arg23. Colouring as in A, except for the mutant Gln23, which is shown as magenta stick model. (C) Immunoblot assay. Indicated constructs (0.5 μg for UFC1C116S, UFC1C116S/T106I or UFC1C116S/R23Q and 2 μg for UFM1) were expressed in UFC1-deficient HEK293T cells. Twenty-four hours after transfection, the cell lysates were subjected to immunoblot analysis with indicated antibodies. Bar graphs indicate the quantitative densitometric analyses of FLAG-UFC1-MYC-UFM1 intermediates relative to free FLAG-UFC1. Statistical analyses were performed using the unpaired t-test (Welch test). The data represent the means ± SE of three separate experiments. *P < 0.05. (D) In vitro thioester formation assay of UFM1 by UFC1. The assay was conducted as described in the ‘Materials and methods’ section. Data shown are representative of three separate experiments. (E) Immunoblot analysis in case (P2, P3, P4: V:1) and control (C1: a healthy Sudanese young females) lymphoblasts. Reducing (DTT plus) and non-reducing (DTT minus) samples were prepared from lymphoblasts and subjected to immunoblot analysis for UFC1 (left), and UFM1 (right). Bar graph indicates the quantitative densitometric analysis of UFC1-UFM1 intermediates relative to free UFC1. Statistical analysis was performed using the unpaired t-test (Welch test). The data represent the means ± SE of three separate experiments. **P < 0.01.

