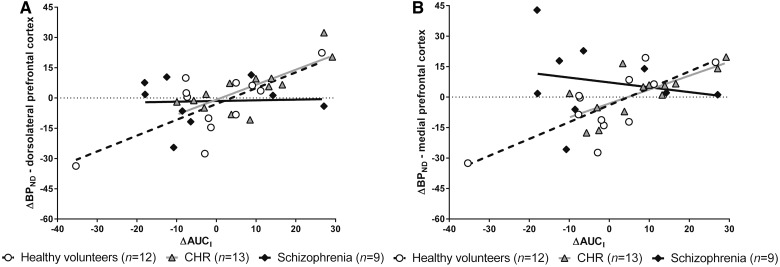
Figure 4.
Associations between ΔBPND and ΔAUCI in healthy volunteers, CHR and schizophrenia. Lines represent the best linear model fit of the data per group (healthy volunteers: dashed line; CHR = grey line; schizophrenia = black line). The correlations were significant in healthy volunteers (A: r = 0.72, P = 0.026; B: r = 0.76, P = 0.014) and CHR (A: r = 0.76, P = 0.0075; B: r = 0.72, P = 0.018), but not in schizophrenia (A: r = 0.46, P = 1.00; B: r = 0.19, P = 1.00). P-values were Bonferroni corrected for multiple comparisons. AUCI = area under the curve; BPND = binding potential.

