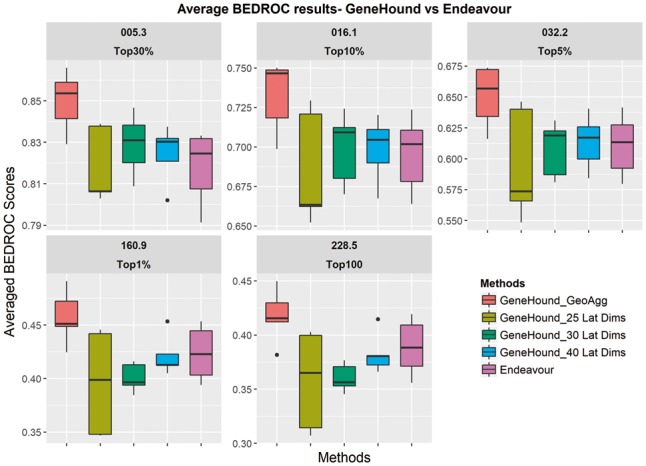
Fig. 3.

BEDROC scores result: GeneHound versus Endeavour.The performance of GeneHound with various latent dimensions, our final model(), and Endeavour are evaluated on our OMIM2 benchmark. The label of each panel corresponds to the value of α used to evaluate the model. Note that we highlight the black solid lines in the box plots correspond to the median value
