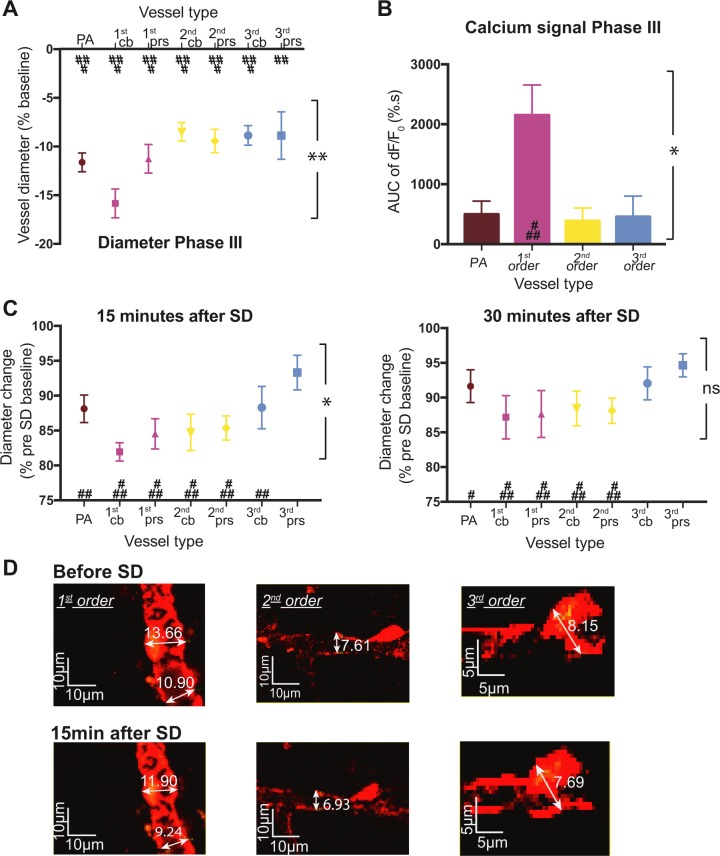
Figure 4.
The long-lasting constriction of spreading depolarization is the strongest at first order capillaries. (A) Measurement of vessel diameter during phase III of spreading depolarization for penetrating arterioles (PA, brown), first (pink), second (yellow), and third (blue) order capillaries at pericyte cell bodies (cb) and processes (prs). All vessels constricted but the greatest reduction in diameter was for first order capillaries at pericyte cell bodies. Values represent the minimum vessel diameter during the constriction period as a percentage of pre-spreading depolarization baseline for 20 spreading depolarization waves. (B) The positive area under the curve (AUC) during phase III was extracted for the fluorescence intensity and normalized to a pre-spreading depolarization baseline. The graph shows calcium fluorescence for vascular smooth muscle cells located on penetrating arterioles (PA, brown) and pericytes on first (pink), second (yellow), or third (blue) order capillaries for six animals. (C) The vessel diameter was measured on z-projections of the vascular tree 15 min after spreading depolarization (left) for n = 18 and 30 min after spreading depolarization (right) for n = 14. Values are normalized to the measurement made on the pre-spreading depolarization z-projection. (D) Magnification of two-photon microscopy images of the z-projection of the vascular tree, with pericytes expressing DsRed protein and appearing in red on first order (left), second order (middle), and third order (right) capillaries before spreading depolarization (top) and 15 min after spreading depolarization (bottom). Data represent the mean ± SEM. **P < 0.01, *P < 0.05 using one-way ANOVA; ###P < 0.0001, ##P < 0.001, #P < 0.01 compared to pre-spreading depolarization baseline with post hoc Sidak test.

