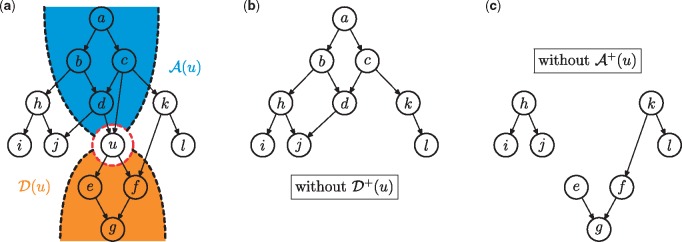
Fig. 3.
Illustration of graph decomposition. The enumeration problem of the original graph from panel (a) is split into two sub-problems based on the pivot vertex u; shown in panels (b) and (c). The count in (b) corresponds to the number of consistent sub-graphs in (a) that do not include u, while the count in (c) corresponds to the count of consistent sub-graphs in (a) that include u. In panel (a), the set of descendants of u is shaded in orange and the set of ancestors is shaded in blue. Notice that the re-occurrence of sub-graph h-i-j in both (b) and (c) offers the possibility of speed-ups by hashing

