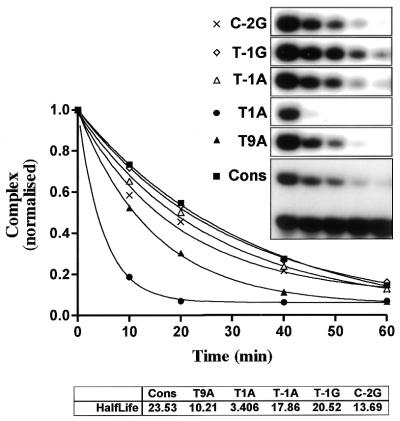
Figure 5.
Myb–DNA complex dissociation: comparative analysis of variant MREs. Time course of complex dissociation upon competition. The oligos are designated T9A, T1A, T–1A, T–1G and C–2G. They all contain a single base pair deviation from the derived consensus sequence, with the first letter indicating the base specified in the consensus, the number giving the position and the last letter indicating the novel base introduced. Complexes of c-Myb and DNA were generated using 20 fmol c-Myb-R2R3 and 10 fmol different MRE probes (Consensus, T9A, T1A, T–1A, T–1G and C–2G) and allowed to form for 15 min at 25°C with 0.1 µg poly(dI·dC) present. The complexes were then exposed to 750 fmol unlabeled MRE-mim-1A probe for 0, 10, 20, 40 and 60 min before samples were analysed by EMSA as described in Materials and Methods. The densities of the complexes were determined using a phosphorimager, normalised and graphically displayed. The half-lives of the complexes were determined after fitting the points by non-linear regression to a one-phase exponential decay curve.

