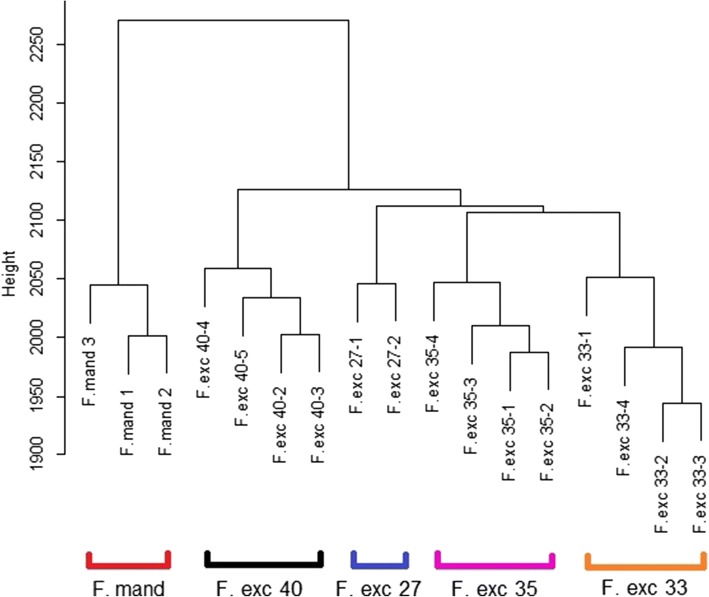
Fig. 8.
Hierarchical clustering of high coverage samples using methylation values from 400,000 positions, shows that samples cluster within each genotype. All samples shown have average genome coverage > 5×, therefore F.exc 35–5, F.exc 40–1, and F. exc 33–5 are removed. These outlier samples clustered away from all other F. excelsior genotypes when included, as if they were outgroups

