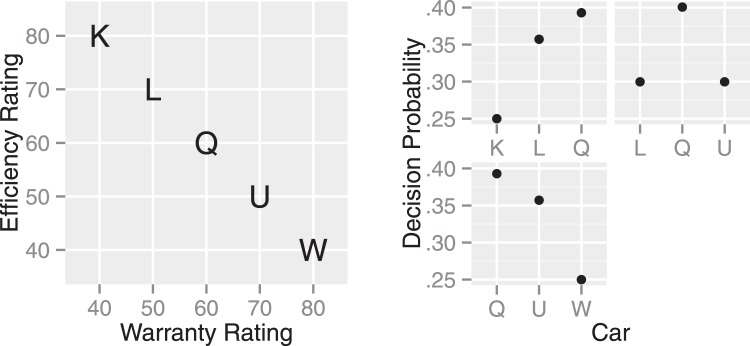
Figure 11.
The attribute balance effect. Here, each car is rated on efficiency and warranty, both of which range from 0 to 100. Car Q is the balanced alternative with the same rating on both attributes (the left panel). The multialternative decision by sampling (MDbS) model predicts a higher decision probability for Car Q, when presented with Cars K and L, with Cars L and U, or with Cars U and W (the right panels).

