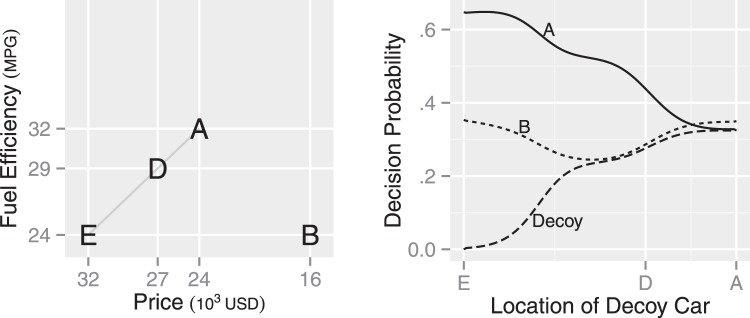
Figure 4.
Effects of varying distance between Car A and the decoy car. The decoy car is located along the gray line in the left panel. The right panel plots the decision probability for each car as a function of the decoy car’s location. The attraction effect briefly strengthens as the decoy car moves away from Car E, but gradually weakens as the decoy car moves closer to Car A.

