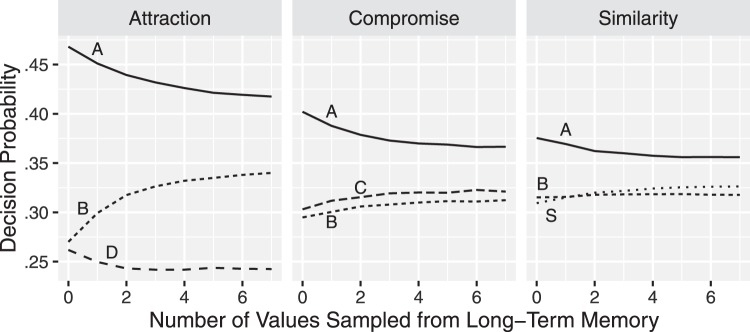
Figure 5.
Decision probability as a function of the number of attribute values sampled from long-term memory. Each panel summarizes mean-average decision probability of 5,000 simulations for each number of samples. With the number of samples from long-term memory, the attraction (left panel), compromise (middle panel), and similarity (right panel) effects all become weaker. In this illustration, attribute values in long-term memory are assumed to follow normal distribution whose mean is the attribute values of Car A, and standard deviation is the absolute difference between Cars A and B. We also assumed that attribute values in long-term memory are weakly correlated at Pearson coefficient = −.2. However, the findings of weakened effects with more long-term memory samples are robust across many possible distributions.

