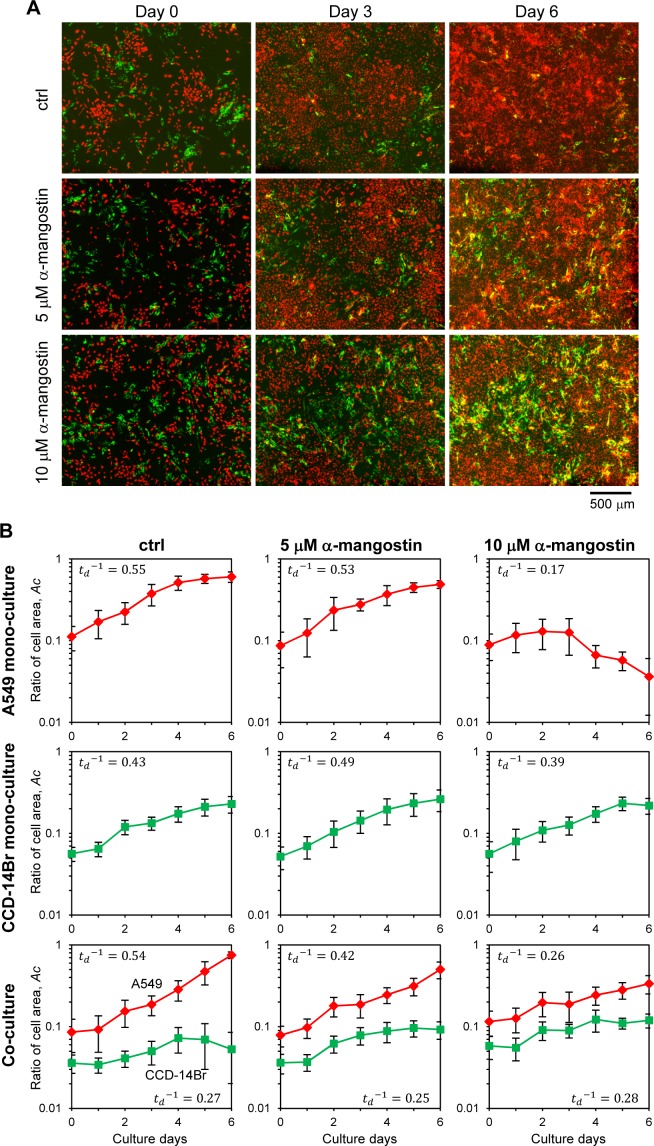
Figure 4. Invasion of cancer A549 to CCD-14Br cells in co-culture conditions treated with α-mangostin.
Cells were cultured in co-culture or monoculture condition, then exposed with or without α-mangostin. (A) Fluorescence images of co-cultured cells. A549 cells were labeled with red fluorescence and CCD-14Br cells were labeled with green fluorescence. (B) Ratio of each cell area, Ac, cultured in monoculture or co-culture with A549 and CCD-14Br cells. The cell area was calculated from more than seven fluorescence images in each condition. Inverse value of the doubling time of each culture condition, (d−1) is shown in each graph.

