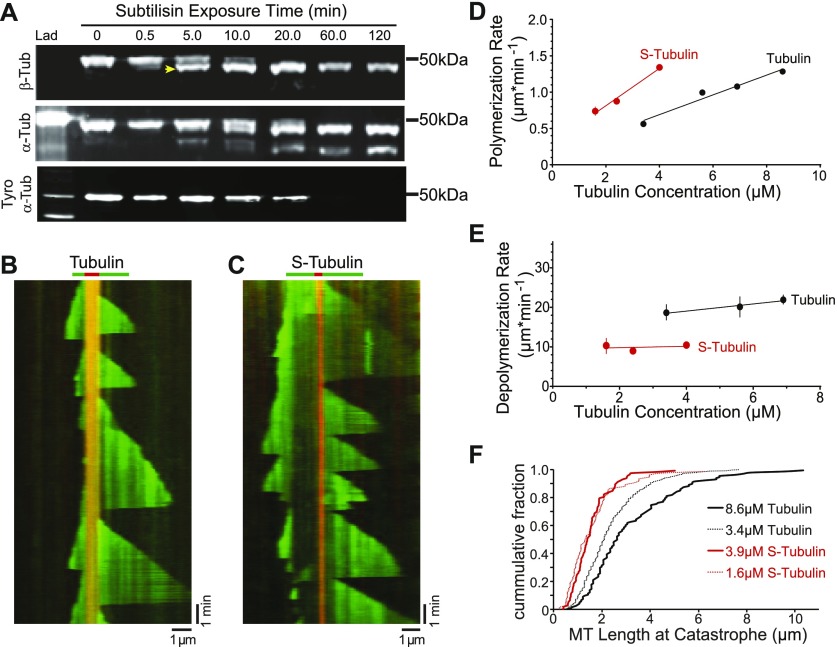
Figure 1. β-CTT promotes microtubule dynamics.
(A) Western blot of tubulin after a time course of subtilisin digestion. Porcine brain tubulin was treated with 1% subtilisin for indicated times at 30°C. Blots were probed with anti-β-tubulin (top), anti-α-tubulin (middle), and anti-α-tyrosinated tubulin (bottom). Arrowhead marks the faster migrating species of β-tubulin produced after 5-min digestion. (B) Representative kymograph of tubulin (green) polymerized from GMPCPP-stabilized microtubule seeds (red), collected at 3-s intervals. Tubulin concentration: 5.6 μM, vertical scale bar = 1 min, and horizontal scale bar = 1 μm. (C) Representative kymograph of S-tubulin as in (B). S-tubulin concentration: 4.9 μM, vertical scale bar = 1 min, and horizontal scale bar = 1 μm. (D) Polymerization rate plotted as a function of tubulin concentration. Data points are mean ± 95% CI plotted for each concentration. Each data point represents at least 197 polymerization events from at least 36 microtubules, collected from four separate experiments. Linear regressions were fit to the data and plotted as solid lines. Black: tubulin; red: S-tubulin. (E) Depolymerization rate plotted as a function of tubulin concentration. Each data point represents at least 62 depolymerization events from at least 28 microtubules, collected from three separate experiments. Data points are mean ± 95% CI plotted for each concentration. (F) Microtubule length at catastrophe plotted as the cumulative fraction of the total population. Tubulin concentrations: 3.4 (black dotted line) and 8.6 μM (solid black line); N = 502 and 125 catastrophe events, respectively. S-tubulin concentrations: 1.6 (red dotted line) and 3.9 μM (solid red line); N = 74 and 112, respectively.
Source data are available for this figure.

