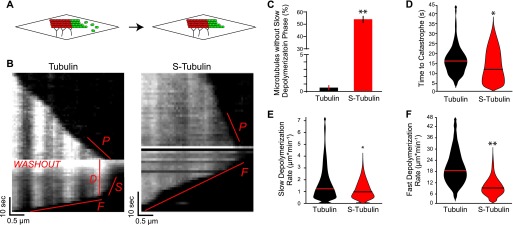
Figure 3. β-CTT promotes microtubule plus-end stability.
(A) Schematic of the washout experiment. (B) Representative kymographs of untreated tubulin (6.3 μM) and S-tubulin (4.3 μM) in the washout experiment. Labels denote aspects analyzed for the washout experiment, including P—polymerization rate, D—delay time to catastrophe, S—slow depolymerization rate, and F—fast depolymerization rate. S-tubulin kymograph does not exhibit the D and S states. (C) Percentage of microtubules without a slow depolymerization rate (B, labeled “S”) for all washout experiments (number of microtubules without S state/total number of microtubules × 100). N = 180 tubulin and n = 94 S-tubulin microtubules, pooled from at least four different experiments for each. Error bars are standard error of the proportion. **P « 0.001, significance determined by Fisher’s exact test. (D) Time to catastrophe (B, labeled “D”) in seconds for tubulin and S-tubulin microtubules after washout. N = 179 tubulin and n = 51 S-tubulin microtubules, pooled from at least four different experiments. Lines represent the median. Microtubules without a detectable slow depolymerization phase were excluded from this analysis. *P = 0.04, significance determined by the Mann–Whitney U test. (E) Slow depolymerization rate (B, labeled “S”) for tubulin and S-tubulin microtubules after washout. N = 162 tubulin and n = 41 S-tubulin microtubules, pooled from at least four different experiments. Lines represent the median. Microtubules without a detectable slow depolymerization phase and/or a rate calculated to be zero were excluded from this analysis. *P = 0.05, significance determined by the Mann–Whitney U test. (F) Fast depolymerization rate (B, labeled “F”) for tubulin and S-tubulin microtubules after washout. N = 179 tubulin and n = 92 S-tubulin microtubules, pooled from at least four different experiments for each. **P « 0.001, significance determined by the Mann–Whitney U test.

