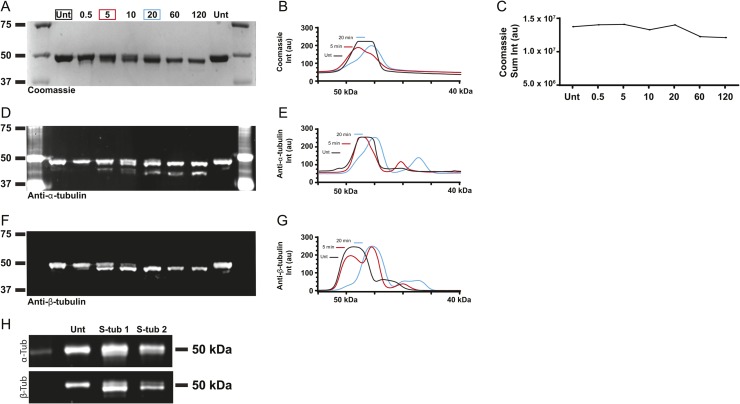
Figure S1. Limited subtilisin digestion of purified porcine brain tubulin.
(A) Coomassie-stained SDS–PAGE gel of tubulin after a time course of subtilisin digestion. (B) Plot of line scans of lanes 2 (black), 4 (red), and 6 (blue). (C) Plot of sum of pixel intensity of respective bands in the Coomassie-stained gel in (A). (D) Western blot of the same samples as in (A), probed with an antibody to α-tubulin (4A1; see the Materials and Methods section). This blot is the same as in Fig 1A (middle). (E) Plot of line scans of lanes 2 (black), 4 (red), and 6 (blue), from the blot in (D). (F) Western blot of the same samples as in (A, B), probed with an antibody to β-tubulin (9F3; see the Materials and Methods section). This blot is the same as in Fig 1A (top). (G) Plot of line scans of lanes 2 (black), 4 (red), and 6 (blue), from the blot in (F). (H) Western blots of the two independent S-tubulin samples made after subtilisin digestion for 5 min at 30ºC, probed for α-tubulin (top; DM1A) and β-tubulin (bottom; 9F3). These samples were snap-frozen and stored at −80ºC in single-use aliquots. Source data are available for this figure.

