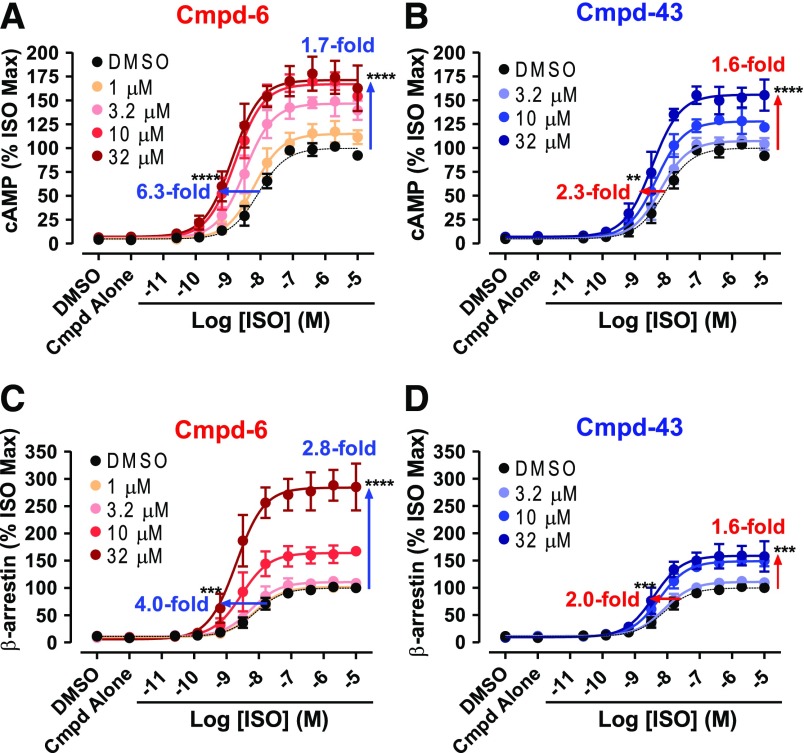
Fig. 2.
Activity assays for G protein activation and β-arrestin2 recruitment in the presence of Cmpd-6 and -43. Either Cmpd-6 (A and C) or Cmpd-43 (B and D) was pretreated in assay cells for 15–20 minutes at various concentrations, as indicated, and then cells were stimulated with ISO in a dose-dependent manner. (A and B) The amount of cAMP production by the endogenously expressed β2AR was measured at 15–20 minutes after stimulation with ISO. (C and D) The level of β-arrestin2 recruitment to the stably overexpressed β2V2R was measured at 6 hours after stimulation with ISO. Curve fits were generated using the software GraphPad Prism with data points obtained from four (B–D) or five (A) independent experiments done in duplicate. Each data point was normalized to the maximal level of the ISO-induced activity in the vehicle (0.32% DMSO) control, expressed as a percentage, and represents mean ± S.D. The shift of curves was expressed as fold changes in EC50 and Bmax values. Statistical analyses for these shifts in each of the directions were performed using one-way analysis of variance, repeated (related) measures with Tukey’s multiple comparison post-tests. P values shown on each graph were for the curve obtained when compound was pretreated at the highest concentration, compared with the control DMSO curve. Adjusted **P < 0.01; ***P < 0.001; ****P < 0.0001.

