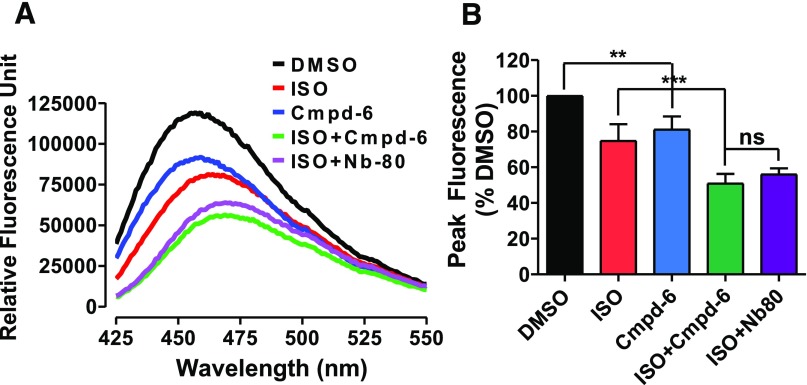
Fig. 4.
Positive allosteric activity of Cmpd-6 in agonist-induced β2AR bimane signals. (A) The fluorescence emission spectrum of monobromobimane-labeled β2AR in HDL particles. Data shown are representative of three independent experiments. (B) Bar graph summarizes the analyses, in which normalized peak fluorescence values are expressed relative to DMSO control (0.2%). Values indicate mean ± S.D. Statistical analysis for the results depicted as the bar graph was performed using one-way analysis of variance, repeated (related) measures with Tukey’s multiple comparison post-tests. Adjusted **P < 0.01; ***P < 0.001; ns, not significant.

