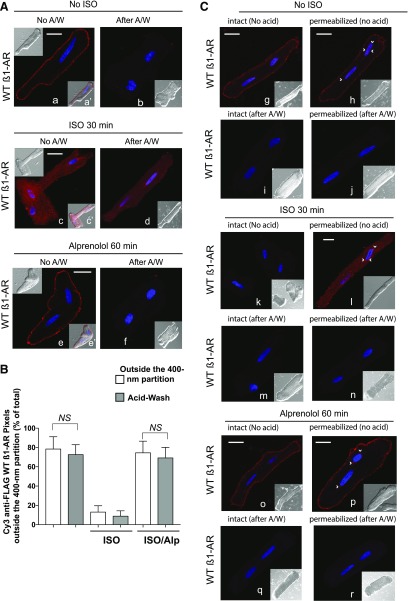
Fig. 1.
Compartmentalization of WT β1-AR in ARVMs. (A) ARVMs expressing the FLAG-tagged human WT β1-AR were prelabeled for 1 hour with Cy3-anti-FLAG antibody and fixed (image a). The rest of the slides were exposed to 10 µM ISO for 30 minutes, fixed (image c) or washed and incubated with 100 µM ALP for 1 hour, and fixed (image e). Slides corresponding to images a, c, and e were subjected to a mild acid wash prior to fixing (images b, d, and f). Cells were imaged and pseudo fluorescence of Cy3 (red) and 4′,6-diamidino-2-phenylindole (violet) is presented. Nomarski image or Cy3-superimposed to the Nomarski image are presented in the upper left or in the right lower quadrant, respectively. (B) Cy3 pixel distribution (mean ± S.E. from a total of 30 images derived from three separate experiments) in ARVMs that were untreated and exposed to ISO or ISO/ALP by the microscopic partition vs. the acid-strip procedure were analyzed by one-way ANOVA followed by Bonferroni’s test with a single pooled variance test. NS, indicates nonsignificant differences between the column pairs. (C) Intact or permeabilized ARVMs prepared as in (A), were incubated with buffer (images g–j), ISO 30′ (images k–n), or ISO/ALP (images o–r) as described in Material and Methods. These slides were incubated with Cy3-anti-FLAG IgG for 1 hour and exposed to neutral (images g, h, k, l, o, and p) or acidic buffer (images i, j, m, n, q and r), and then fixed and visualized by confocal microscopy. Each scale bar in (A) and (B) represents 15 µm. Small arrows indicate nuclear fluorescence.

