Fig. 2.
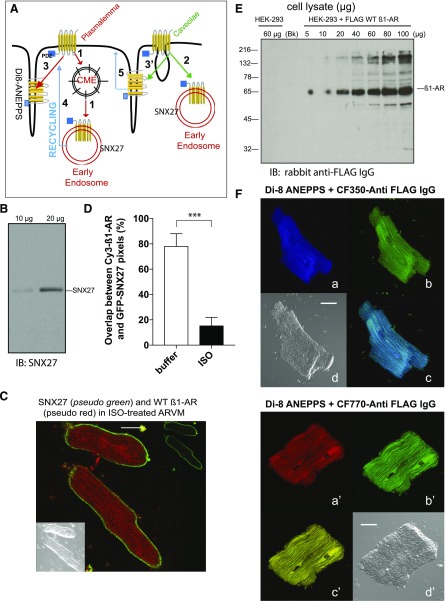
Fluorescence colocalization microscopy between WT β1-AR and intracellular markers in ARVMs. (A) Cartoon representing modes of agonist-mediated GPCR internalization. The majority of GPCRs are endocytosed from the surface membrane to early endosomes by clathrin-mediated endocytosis into early endosomes (number 1), or from caveolae into early endosomes (number 2). The cartoon also indicates that GPCRs may translocate to T-tubules, which are continuous with the plasma membrane in agonist-exposed ARVMs (number 3). Specific markers for early endosomes and T-tubules, such as SNX27 and Di-8 ANEPPS, respectively, may provide clues about the intracellular compartment harboring the β1-AR in ISO-exposed ARVMs. Also depicted are possible mechanisms for GPCR recycling from their intracellular compartment back to the surface membrane (number 4) or caveolae (number 5). (B) Western blotting of 10 or 20 µg of ARVM cell lysates with anti-SNX27. (C) Colocalization between CF-770 labeled WT β1-AR (pseudo red) and GFP-labeled SNX27 (pseudo green) in ISO-exposed ARVMs. The scale bar represents 20 µm. (D) Statistical comparison of CF-770 vs. GFP pixel overlap (mean ± S.E. from 30 images derived from three separate experiments) in ARVMs that were untreated (buffer) or exposed to ISO for 30 minutes. Statistical comparisons in the percentile of overlapping pixels between the two groups were carried out by student’s t test. P values are expressed as nonsignificant to indicate no significant difference or *, **, and *** to indicate P < 0.05, P < 0.01, and P< 0.001, respectively. (E) Western blotting of increasing amounts of cell lysates prepared from HEK-293 stably expressing FLAG-β1-AR that were probed with rabbit polyclonal anti-FLAG IgG. (F) ARVMs expressing the WT FLAG β1-AR were incubated with 5 µg/ml of rabbit anti-FLAG IgG for 1 hour and then exposed to buffer or ISO for 30 minutes as described in Fig. 1A. These slides were incubated with 10 µM Di-8 ANEPPS, washed, and then fixed. Slides were permeabilized and incubated with CF350- (a–d) or CF770-goat anti-rabbit IgG (images a′–d′) for 30 minutes and visualized by confocal microscopy. Di-8 ANEPPS staining (pseudo green in images b and b′) and Nomarski images (images d and d′) are shown. Distribution of fluorescent pixels for CF-350 (pseudo violet in image a) or CF-770 (pseudo red in image a′) were superimposed on Di-8 ANEPPS staining (pseudo cerulean or yellow in images c and c′, respectively). Each scale bar in (A) and (B) represents 10 µm.

