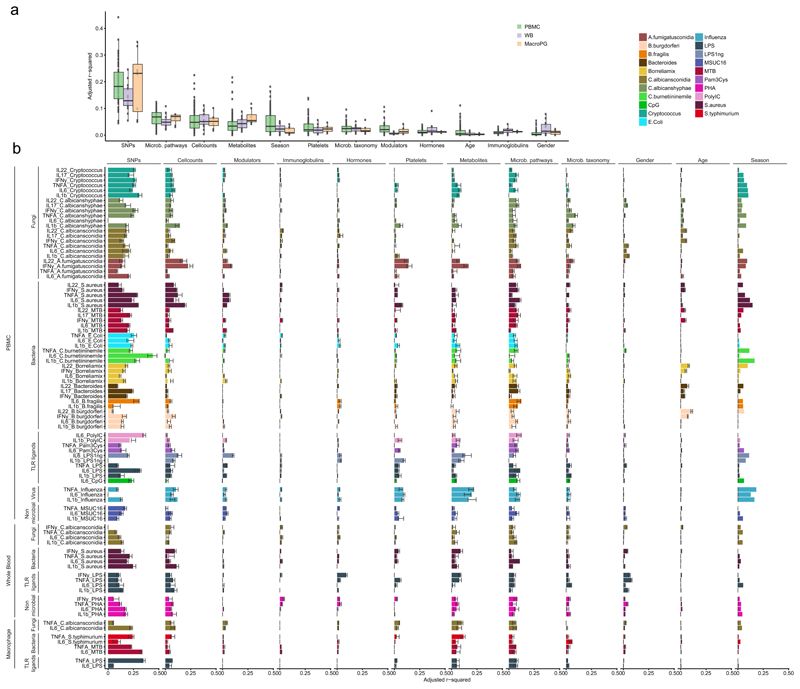
Figure 2. Contribution of baseline immune parameters and multi-omics to cytokine variation.
(a) Percentage of variation in stimulated cytokine production explained by each category of measurements. The distribution indicates the adjusted R2 of a set multivariate linear models (MVLM) representing cytokine stimulation pairs from PBMC (n=67 models), whole blood (n=16 models) and PBMC derived macrophages (n=8 models). Each dot represents the adjusted R2 of a MVLM for a specific cytokine stimulation pair. (b) Contribution of each category to inter-individual cytokine variation. X-axis denotes the adjusted R2 values for the MVLMs. Bars indicate the adjusted R2 estimated on the full dataset. Error bars indicate the standard deviation in adjusted R2 of 10 MVLMs trained on a random subset of samples from the full data (90% of all samples). Y-axis denotes the cytokine-stimulation pairs. Colors indicate different stimulations applied in the experiments. Sample sizes differ between the different categories with the platelet, immune modulator, immunoglobulin and classical phenotypes having n = 489, the immune cell counts n = 472, the metabolites n = 377, microbial pathways n = 384, microbial taxonomy n = 411, hormones n = 486 and SNPs n = 392 samples. Every sample represents an individual.

