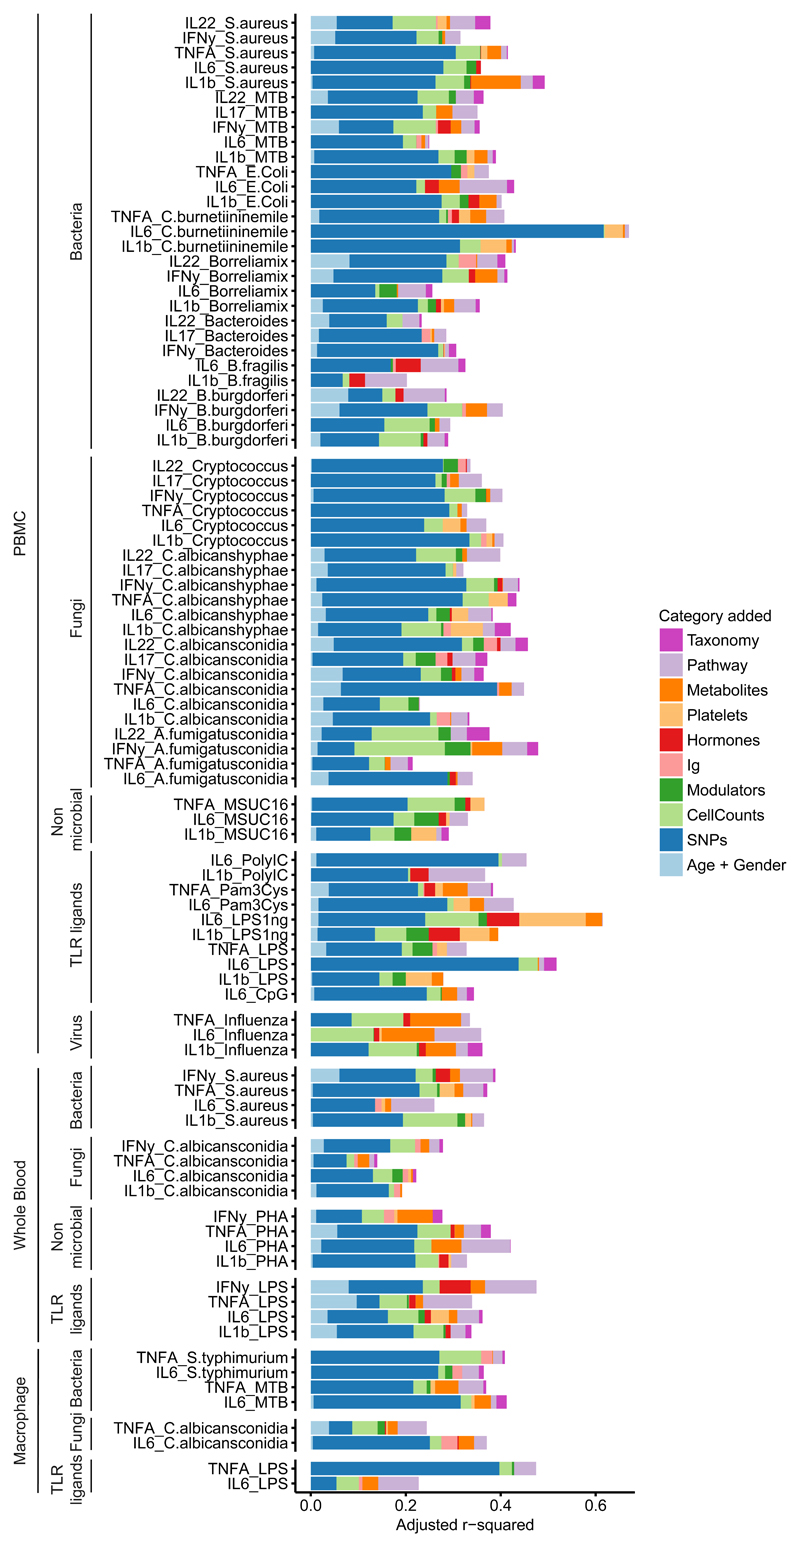
Figure 4. Cumulative contribution of multiple baseline traits to the variation in stimulated cytokine production.
Adjusted R2 values (x-axis) obtained from multivariate linear models (MVLM) increase when measurements from 10 categories are added sequentially. Each colored bar represents how much additional variation (on top of the preceding colors) the MVLM for that category explains. The order in which features from a dataset were added is from left to right. The combined dataset consisted of 266 samples. Each sample represents an individual. Gene expression was not included in this analysis because of the relatively small sample size of the RNA-seq experiment after overlapping with the other datasets (n = 69). X-axis denotes adjusted R2 values. Y-axis denotes different cytokine-stimulation pairs.

