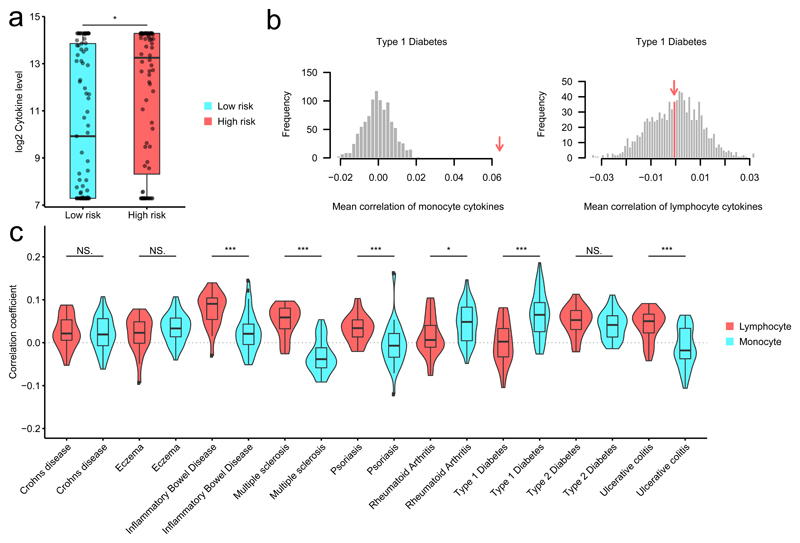
Figure 6. Stimulated cytokine production correlates with genetic risk score for autoimmune diseases.
(a) Example individuals with high genetic risk for (auto)immune disease tend to be high producers of cytokines in response to pathogens. * indicates the significance of the Wilcox rank sum test between low- and high-risk groups for T1D (P=0.011). Low- and high-risk groups (x-axis) were selected by taking the top and bottom quantile of the PRS for T1D. Y-axis indicates the IL-6 level after stimulation of PBMCs with influenza. (b) Distribution mean correlations between T1D risk in monocyte-derived cytokines (left panel) and lymphocyte cytokines (right panel) for 1000 permutations. The measured estimate is indicated by the red arrow. T1D shows significance for monocyte derived cytokines (left) but not for the lymphocyte derived cytokines (right). (c) Distribution of Spearman correlation coefficients between stimulated cytokine production and genetic risk score for immune disease in 430 individuals, shown for PBMC. Genetic risk scores calculated based on genome-wide association studies for different diseases. Significant differences in mean correlation between the lymphocyte- and monocyte-derived cytokines are shown by Wilcox rank sum test (* P < 0.05, ** P < 0.01, *** P < 0.001). Exact p-values are as follows Crohns disease P=7.28E-01, Eczema P=2.55E-01, Inflammatory Bowel Disease P=9.34E-06, Multiple sclerosis P=4.85E-11, Psoriasis P=1.40E-04, Rheumatoid Arthritis P=1.41E-02, Type P=1 Diabetes P=1.00E-05, Type P=2 Diabetes P=1.65E-01, Ulcerative colitis P=1.34E-05.

