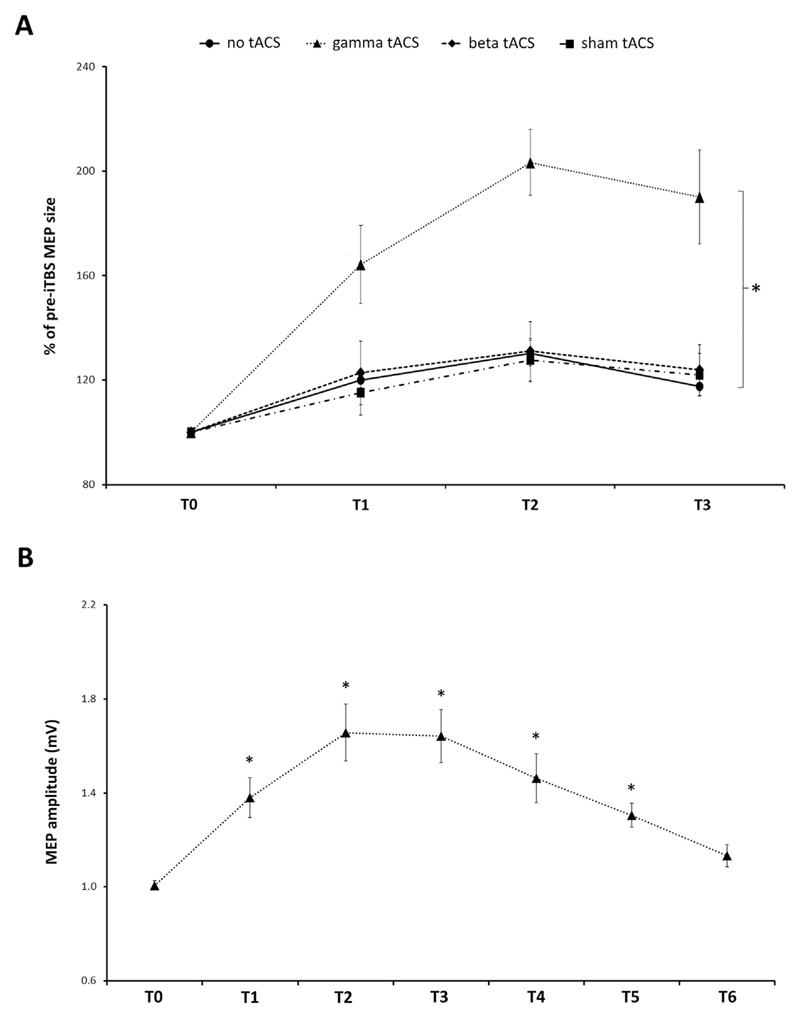
Fig. 2.
A, Effect of tACS-iTBS co-stimulation. When γ-tACS was delivered during iTBS, a significant MEP facilitation was observed compared with the other sessions (rm ANOVA with the factors ‘session’ and ‘time point’ identified a significant main effect of ‘session’ (p < 0.001); * = significant post-hoc t-tests for the factor ‘session’, p < 0.01). No differences were detected between iTBS (no tACS), iTBS-sham tACS and iTBS-β tACS. MEP amplitudes (average ± SEM) for each time point (i.e. after 5 min - T1, 15 min - T2, and 30 min - T3) after-iTBS are compared with pre-iTBS values (set as 100% - T0). B, Time course of iTBS-γ tACS. MEPs were recorded at six different time points after iTBS and compared with pre-iTBS (T0) MEP amplitude values: after 5 min (T1), 15 min (T2), 30 min (T3), 60 min (T4), 90 min (T5) and 180 min (T6). Average MEP amplitude ± SEM is shown. * = time points that were significantly different from T0 after post-hoc comparisons (p < 0.05). P values are presented after Bonferroni's correction for multiple comparisons.

